Голова и плечи
сформирован 13.06 в 20:20:21 (UTC+0)
сила сигнала 1 из 5
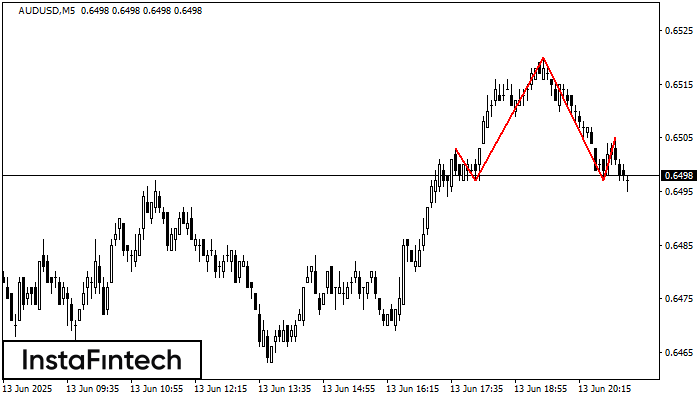
Графическая фигура «Голова и плечи» сформировалась по инструменту AUDUSD на M5. Вероятно предполагать, что после формирования правого плеча цена преодолеет уровень шеи 0.6497/0.6497, изменяя тем самым тенденцию и фактически направляя нас к значению 0.6482.
Таймфреймы М5 и М15 могут иметь больше ложных точек входа.
- Все
- Все
- Bearish Rectangle
- Bearish Symmetrical Triangle
- Bullish Rectangle
- Double Top
- Double Top
- Triple Bottom
- Triple Bottom
- Triple Top
- Triple Top
- Все
- Все
- Покупка
- Продажа
- Все
- 1
- 2
- 3
- 4
- 5
Triple Top
сформирован 25.07 в 11:50:39 (UTC+0)
сила сигнала 1 из 5
The Triple Top pattern has formed on the chart of the USDJPY M5 trading instrument. It is a reversal pattern featuring the following characteristics: resistance level -5, support level -14
The M5 and M15 time frames may have more false entry points.
Открыть график инструмента в новом окне
Triple Top
сформирован 25.07 в 11:50:14 (UTC+0)
сила сигнала 1 из 5
The Triple Top pattern has formed on the chart of the EURJPY M5 trading instrument. It is a reversal pattern featuring the following characteristics: resistance level 4, support level -5
The M5 and M15 time frames may have more false entry points.
Открыть график инструмента в новом окне
Bullish Rectangle
сформирован 25.07 в 11:36:37 (UTC+0)
сила сигнала 1 из 5
According to the chart of M5, GBPJPY formed the Bullish Rectangle which is a pattern of a trend continuation. The pattern is contained within the following borders: the lower border
The M5 and M15 time frames may have more false entry points.
Открыть график инструмента в новом окне