
Lihat juga


 07.09.2026 05:06 AM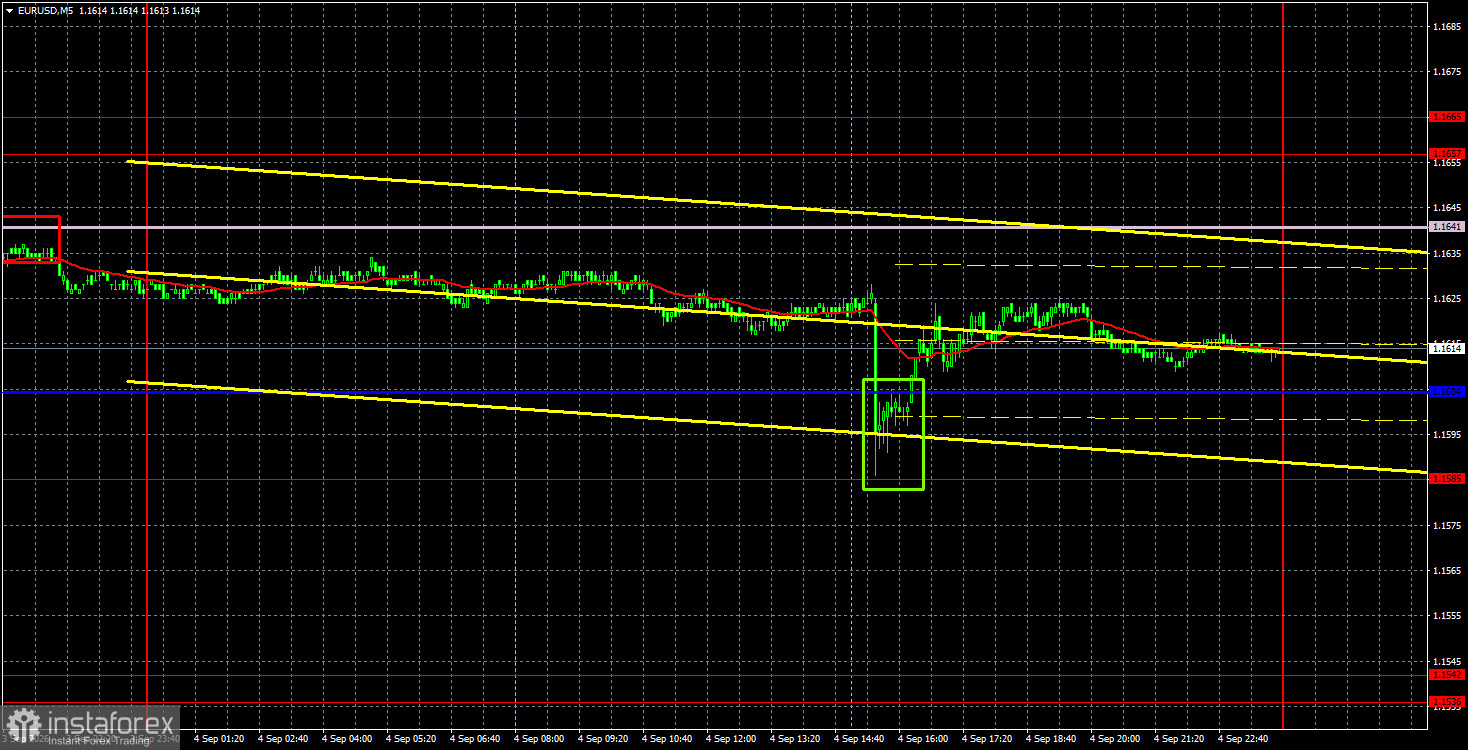
The EUR/USD currency pair once again had strong chances of continuing to decline on Friday, but the euro avoided that outcome. Briefly recall that last week, during the first three days, macroeconomic data favored the euro, yet the dollar rose the whole time — moderately and slowly. On Thursday and Friday, the US released a strong ISM services index, Nonfarm Payrolls three times higher than forecasts, and a neutral unemployment rate. And all the dollar managed in those two days was a 20-pip decline. How is it possible that with such strong support the dollar failed to strengthen? We believe the market has already adjusted in reality to selling the US currency, and confidence in Federal Reserve tightening has evaporated. Throughout 2026, we have repeated the same point: the dollar has only one supporting factor — geopolitics. That factor has an expiration date that has long passed. The market cannot keep buying the US currency for years while the Middle East conflict continues. Capital flight has already occurred; there is nothing left for the dollar to rely on.
Technically, the pair has completed the downtrend, as evidenced by the break of the trendline. However, Senkou Span B has not yet been breached, so in theory the dollar's rise could still resume. This week, the dollar's direction will depend on the inflation report, which is also due on Friday. Thus, for the third consecutive week, the dollar's fate will be decided on Friday.
On the 5-minute TF on Friday, exactly one trading signal formed. After the Nonfarm release, the price plunged by about 50 pips, allowing it to test the 1.1585 Kijun-sen area. A rebound from this area allows a new phase of growth to begin this week, unless the US inflation report signals an acceleration.
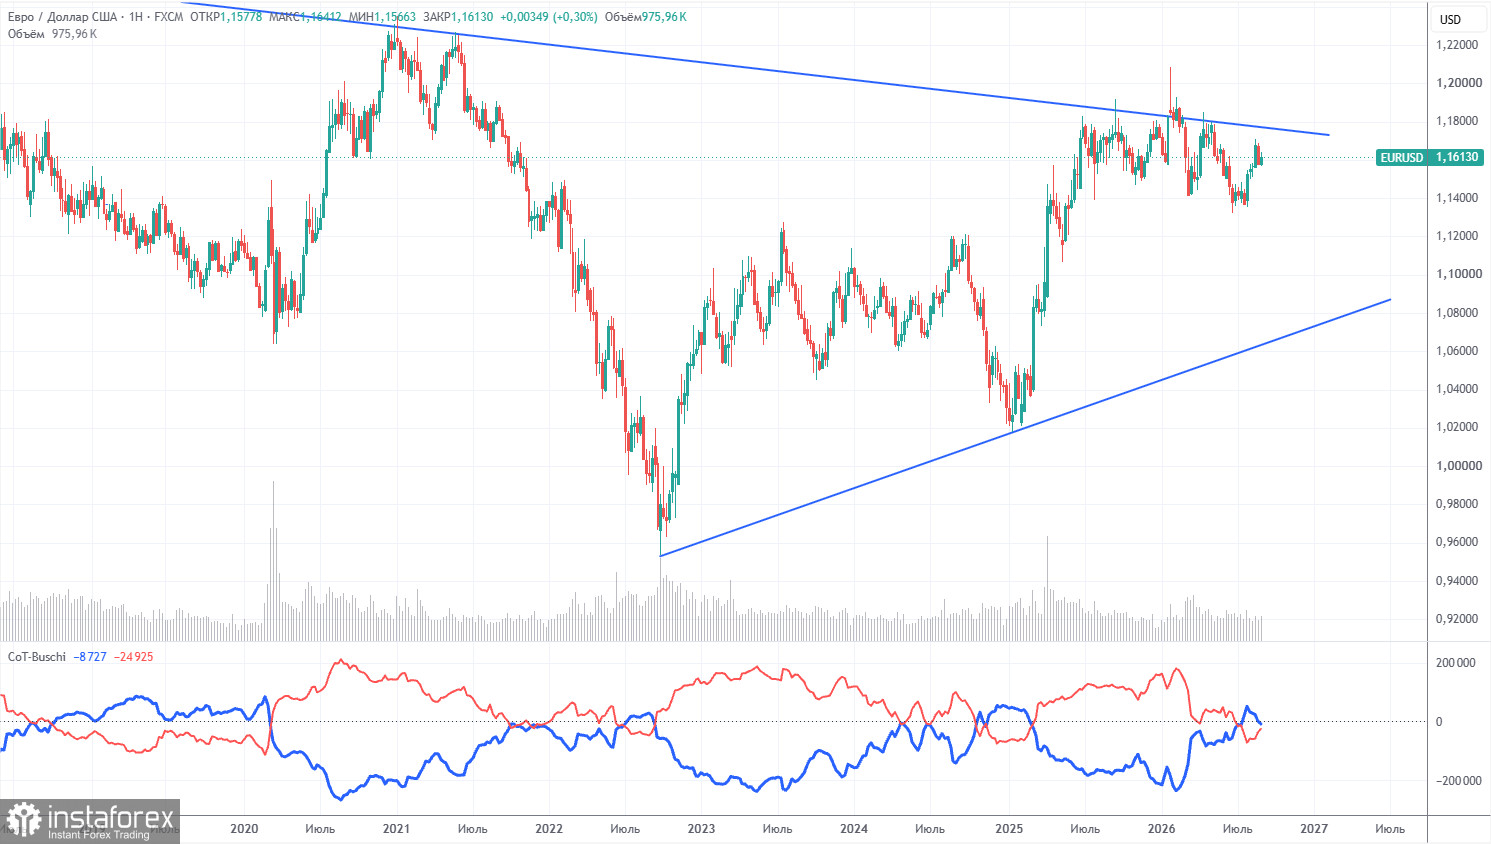
The latest COT is dated September 1. On the weekly TF, it is clear that non-commercial traders' net position turned bearish and fell significantly in 2026 due to geopolitical events. Traders have been trimming euro exposure in favor of the US dollar over the past six months. Trump's policy has not changed, but the dollar has, for a time, acted as the "reserve currency."
However, we still see no fundamental factors for further dollar strengthening. The Middle East war made the dollar temporarily super-attractive, but when that factor expires, everything will return to normal — and that expiration may already have occurred. In the long term, the euro could fall to 1.08 (trendline), but the uptrend will remain relevant. After recent months of dollar strength, the pair has not approached that trendline much.
The red and blue COT lines indicate approximate parity between bulls and bears. During the last reporting week, Non-commercial longs rose by 4,500 while shorts fell by 6,900. Accordingly, the net position increased by 11,400 contracts for the week.
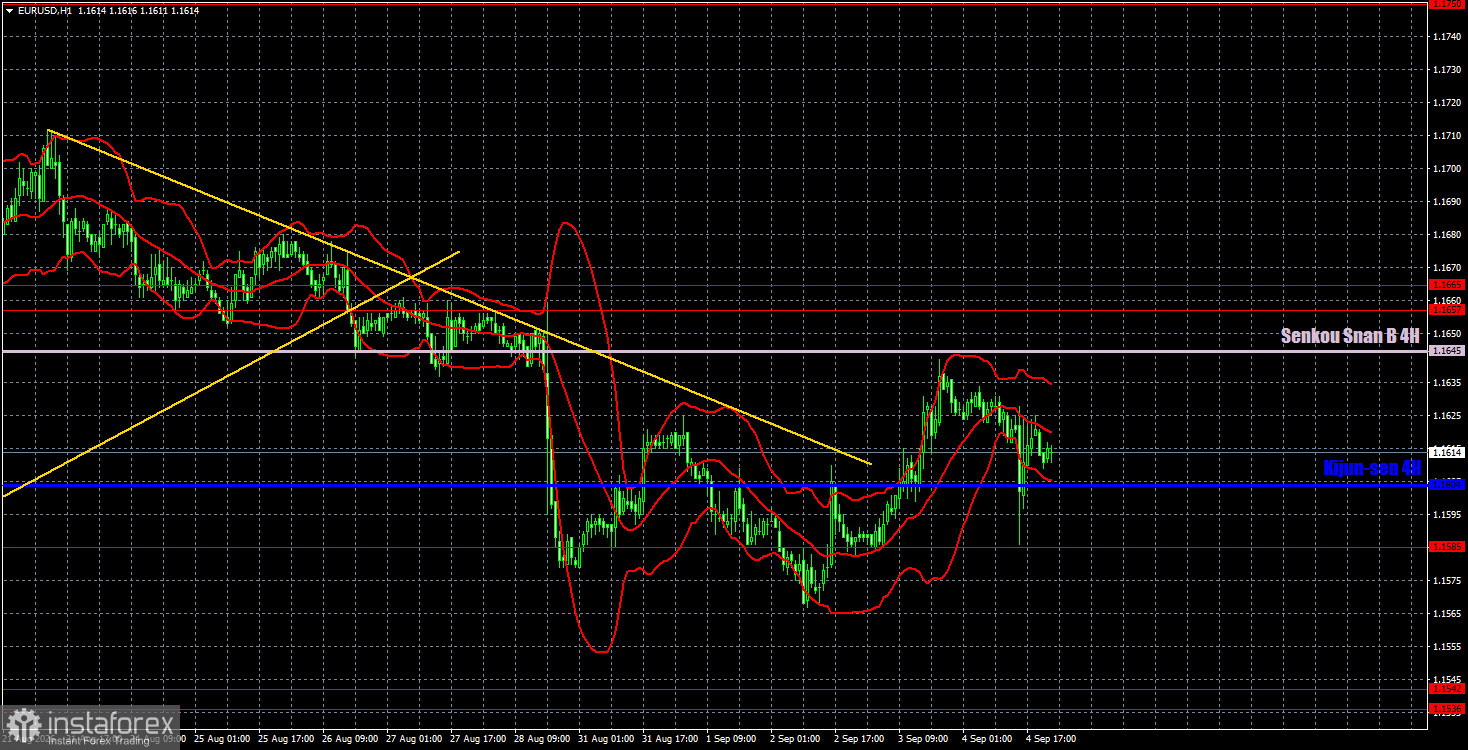
On the hourly TF, EUR/USD may begin a new upward trend. The situation in the Middle East remains tense and is not improving, but that alone is insufficient to trigger a new strong-dollar rally. Kevin Warsh's remarks and the annual Nonfarms supported the dollar, but we see no compelling reasons for optimism about the US currency. A break above Senkou Span B would open the way up for the euro.
For September 7 we highlight the following trading levels — 1.1234, 1.1274, 1.1362–1.1368, 1.1461–1.1473, 1.1536–1.1542, 1.1585, 1.1657–1.1665, 1.1750–1.1760, 1.1786, 1.1830–1.1837, and the Senkou Span B (1.1645) and Kijun-sen (1.1604) lines. Ichimoku lines can shift during the day, which should be considered when taking signals. Move Stop Loss to breakeven if price moves 15 pips in the favorable direction to protect against false signals.
On Monday, the EU will publish the third estimate of Q2 GDP, and Germany will release industrial production data. We consider both secondary and expect little market reaction. Volatility may again be muted.
Today traders may consider short positions targeting 1.1536–1.1542 if price holds below the Kijun-sen line. A rebound from the 1.1585–1.1604 area allows opening long positions targeting 1.1645 and 1.1657–1.1665.


