আরও দেখুন

 17.02.2026 09:39 AM
A calm before the storm. US equity floors were closed yesterday for Presidents' Day, so attention focused on futures. Nasdaq futures fell, S&P 500 futures swung between small gains and losses, and the Dow futures ticked up — a snapshot of rotation in progress.
Dynamics of US equity indices
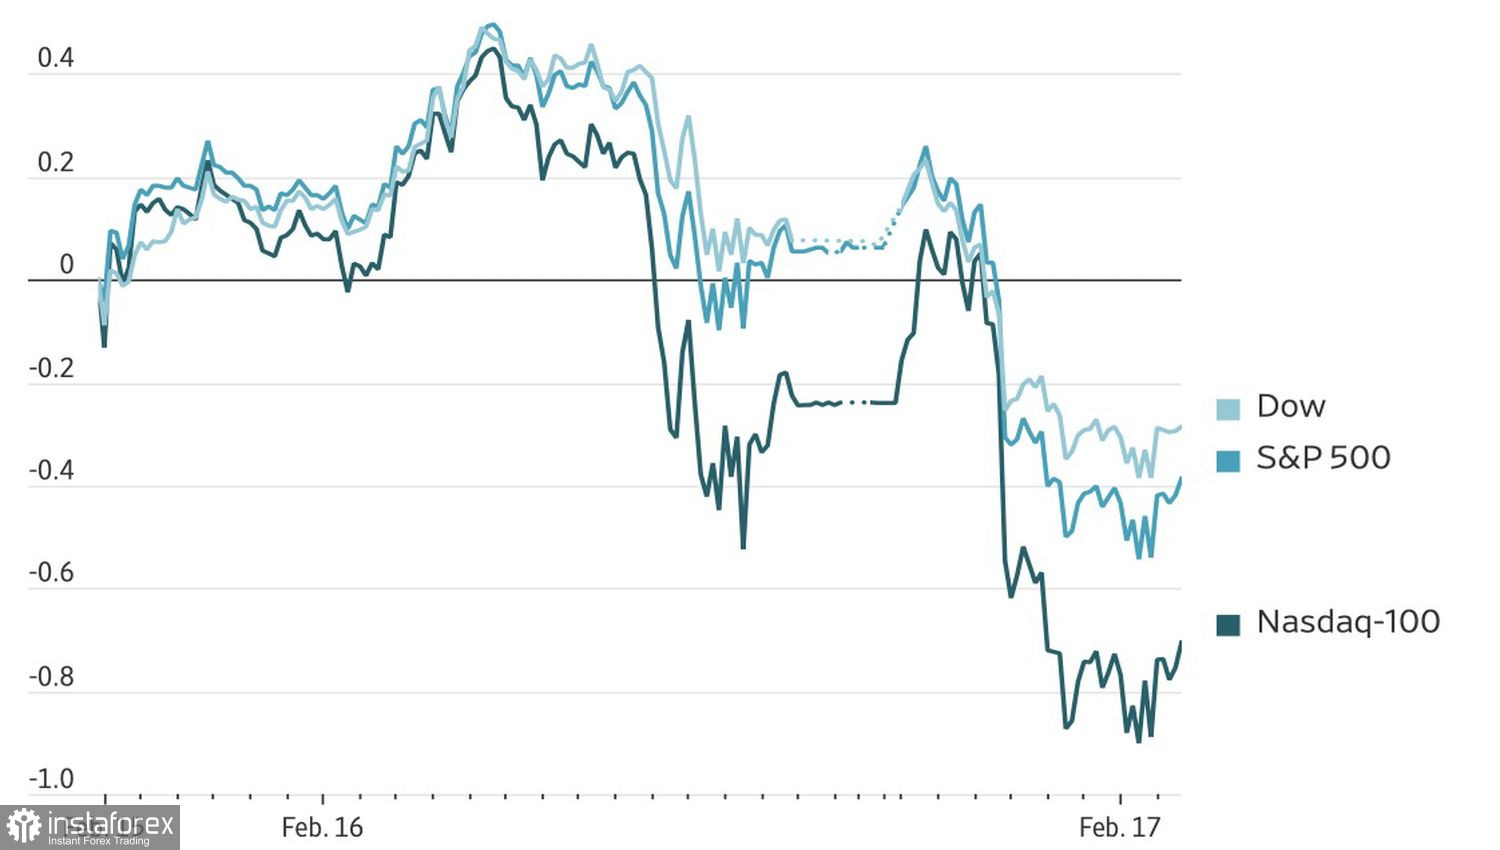
This rotation, along with expectations of resumed Fed easing and ongoing geopolitical issues, is dominating the market. Donald Trump has threatened military action if Iran does not sign a nuclear deal. In response, Tehran is conducting military drills, which is damping global risk appetite.
Nevertheless, the Middle East is far away, and investors are focused on more immediate questions: when will the Fed lower interest rates? Clues could come from the January FOMC minutes and upcoming GDP and personal consumption spending releases.
Market attention is likely to shift progressively toward consumer activity. Alongside macro prints, Walmart, the first retailer to reach a $1 trillion market cap, will report Q4 results, which the market will scrutinize closely.
Dynamics of software stocks
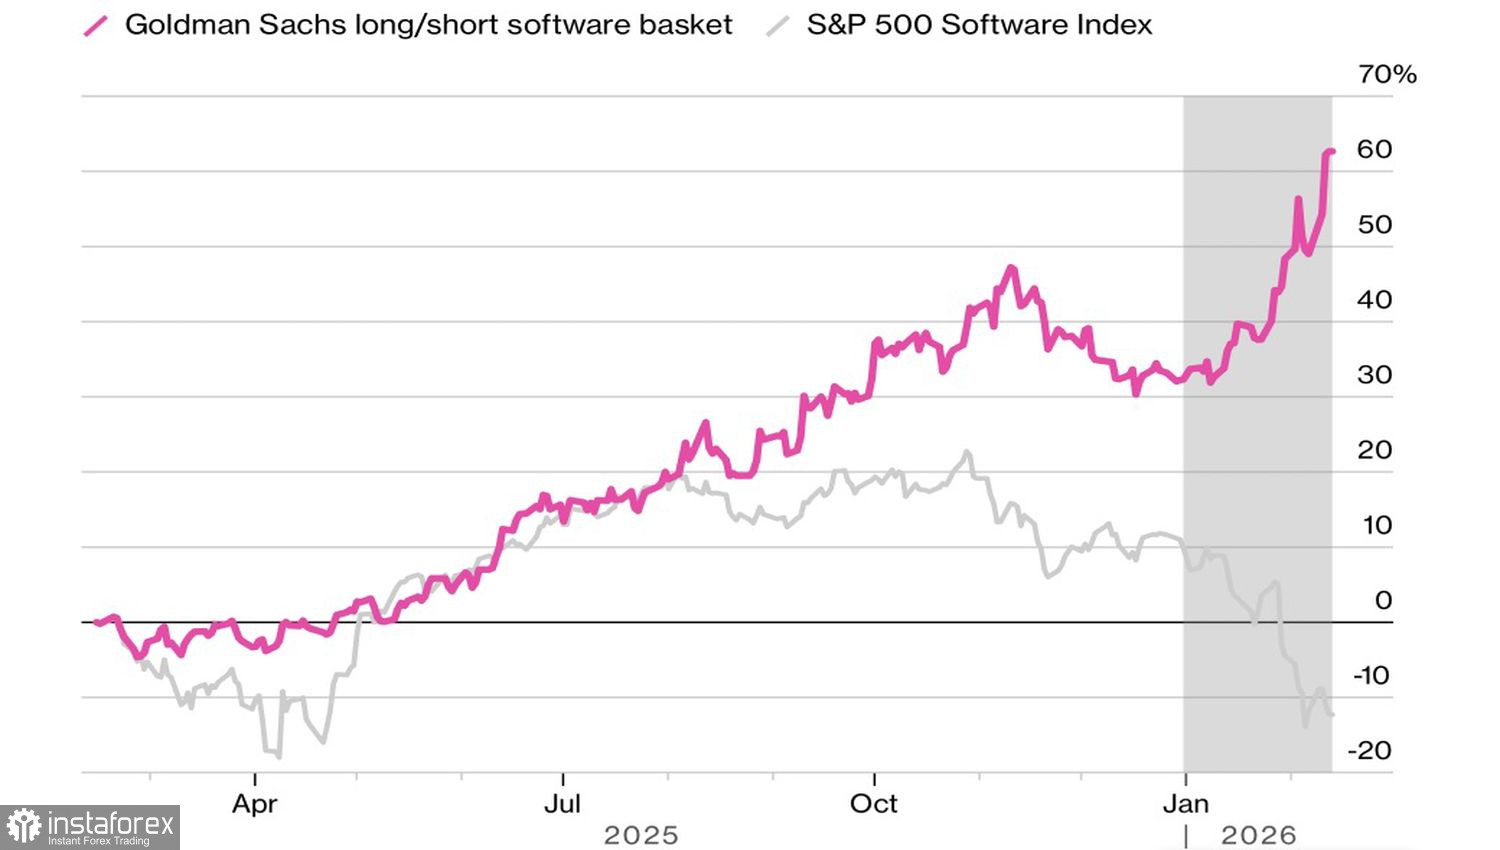
Meanwhile, the market is still wrestling with how artificial intelligence will affect S&P 500 companies. Goldman Sachs published a basket of AI winners and losers among software producers; that basket is up about 60% since May.
Earnings season is winding down: 369 S&P 500 companies have reported and, according to LSEG, roughly 80% beat Wall Street EPS estimates. That, combined with 13% aggregate profit growth, keeps JPMorgan bullish on US equities.
It is possible the tech sell-off has gone too far. The AI story should have both winners and losers, yet the market has become fixated on losers — that's an unbalanced view.
Investors will pore over the January FOMC minutes. Two dissenters were in the room, notably, Stephen Miran and Christopher Waller. It will be interesting to learn Waller's rationale: was it a bid for the Fed chair role or political positioning, favoring rate cuts to appease Trump? Or was it simply a judgment based on the labor market and inflation dynamics?
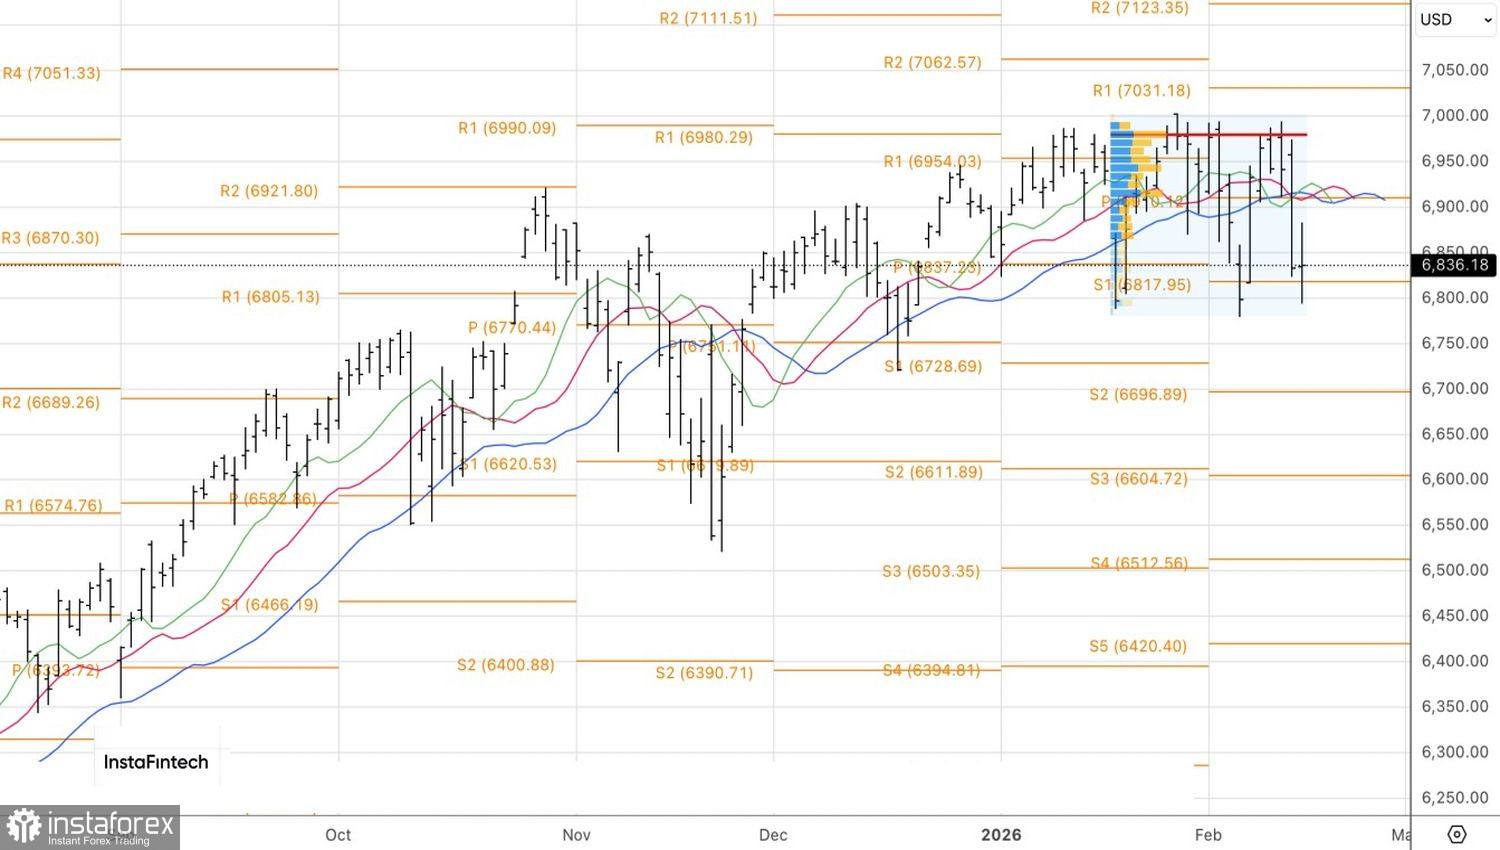
As for the S&P 500 technical analysis, the daily S&P chart shows a wide-body bar followed by a doji with long upper and lower wicks — a classic sign of high uncertainty. A break below the pivot support level of 6,815 would allow traders to build on earlier short positions on the broad index. Conversely, a failure to break could form a double bottom pattern.


