
আরও দেখুন


 20.07.2026 01:42 PM
Constant dripping wears away the stone, and two small streams of capital can erode even the most stubborn crypto winter. US spot Bitcoin ETFs recorded net inflows for the second week in a row after nearly two months of investor flight: $75.7 million in the week to July 17, following $197.4 million in the week before. This is despite panic withdrawals of $424.7 million from funds on the eve of the US–Iran conflict escalation.
Capital flow dynamics in Bitcoin ETFs
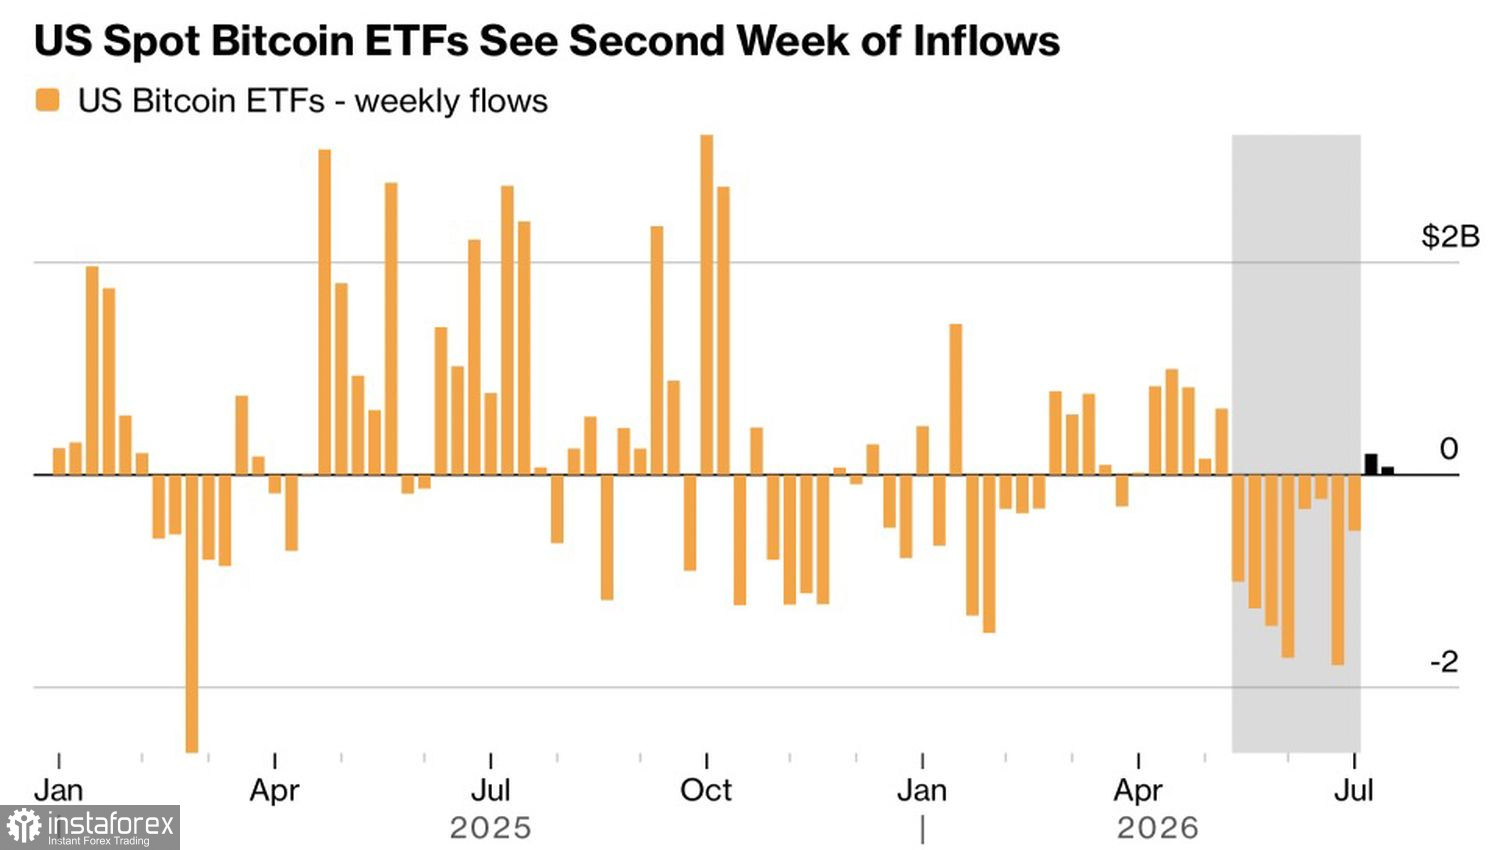
DACM believes the reversal in flows into bitcoin ETFs, together with inflows into ether funds, may signal a return of positive sentiment to the crypto market. The firm explicitly calls this a sign of a bottom: given their scale, ETFs have long been a reliable indicator of investor mood, and two consecutive five?day periods of positive flows after eight weeks of outflows look convincing.
Bitcoin has moved back above the 200-week moving average at around $63,300 — a line traders consider the boundary between a protracted bear market and a bull market. For several weeks, the token was locked in the $60,000–65,000 range amid macroeconomic uncertainty. Even new US strikes on Iran failed to knock BTC/USD off course: in Asia, prices briefly rose above $65,000.
However, an armed conflict carries inflationary risks and with them the threat of tighter Federal Reserve policy. Ericsenz Capital warns that the prospect of rate hikes could delay a full return of institutional capital. Passing the Clarity Act in Congress before the August recess would be a potential catalyst for a new rally.
Bitcoin drawdown dynamics
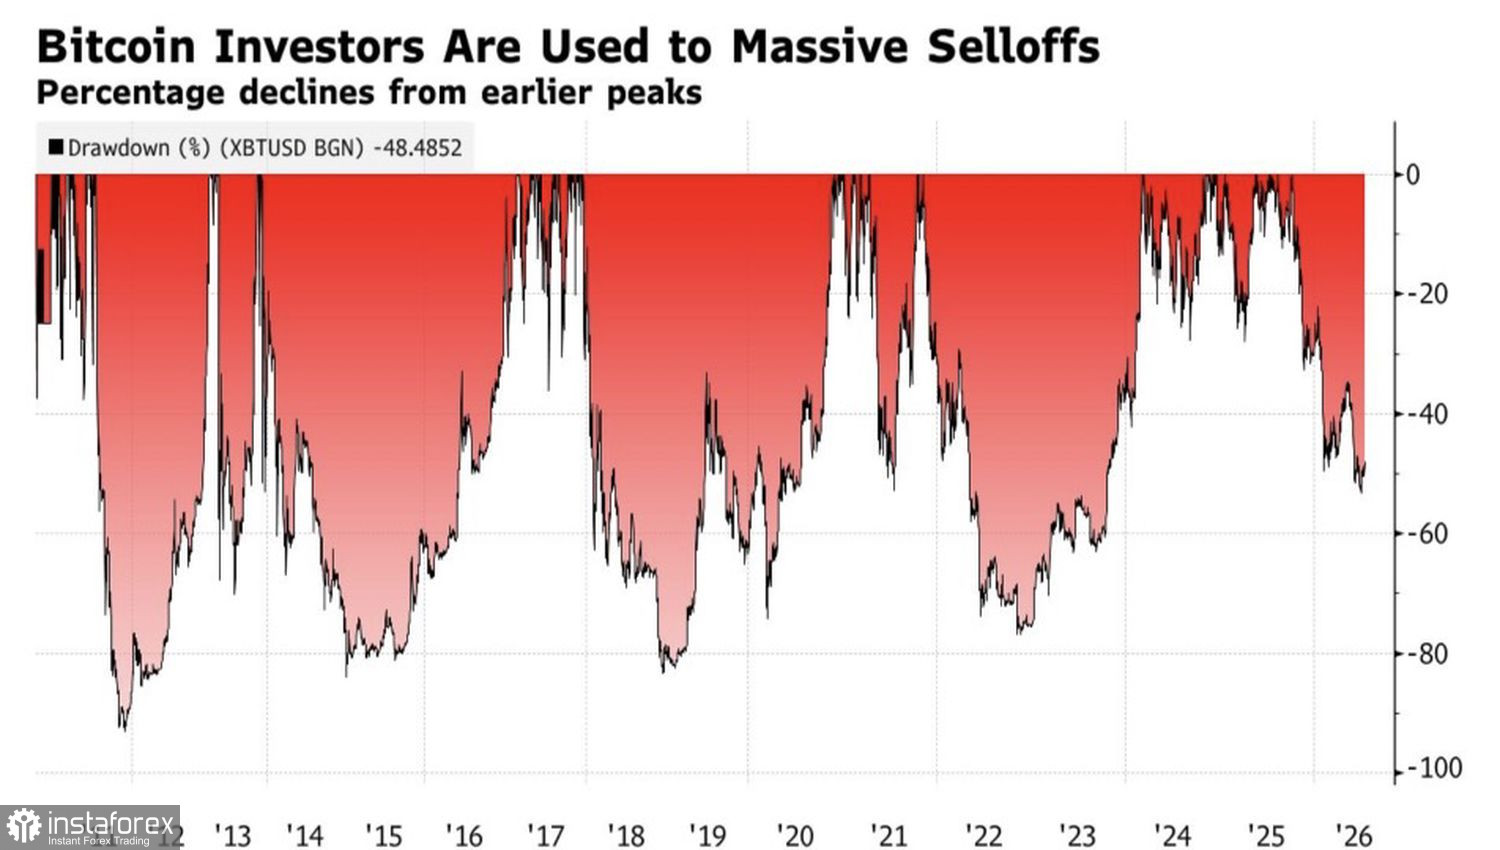
That said, nobody knows how things will play out. A year ago, Bitcoin's outlook looked bright: the industry avoided scandals, and regulators gave digital assets a firmer legal footing. In reality, the cryptocurrency has lost half its value from the October peak above $126,000, retreating to September 2024 levels. Past crypto winters were deeper — up to 80% from highs — but the current decline has been more painful for Bitcoin supporters because it stems from a gradual loss of investor interest rather than a one-off shock.
Institutional demand via ETFs helped the token recover after the 2022 crypto winter. But now, with market rates rising alongside inflation, a non-yielding asset loses appeal and increasingly trades like a regular risky instrument, competing with perpetual futures and prediction markets like Polymarket.
One swallow does not signal a summer. Two weeks of inflows are only the start of the journey, not a confirmed trend reversal.
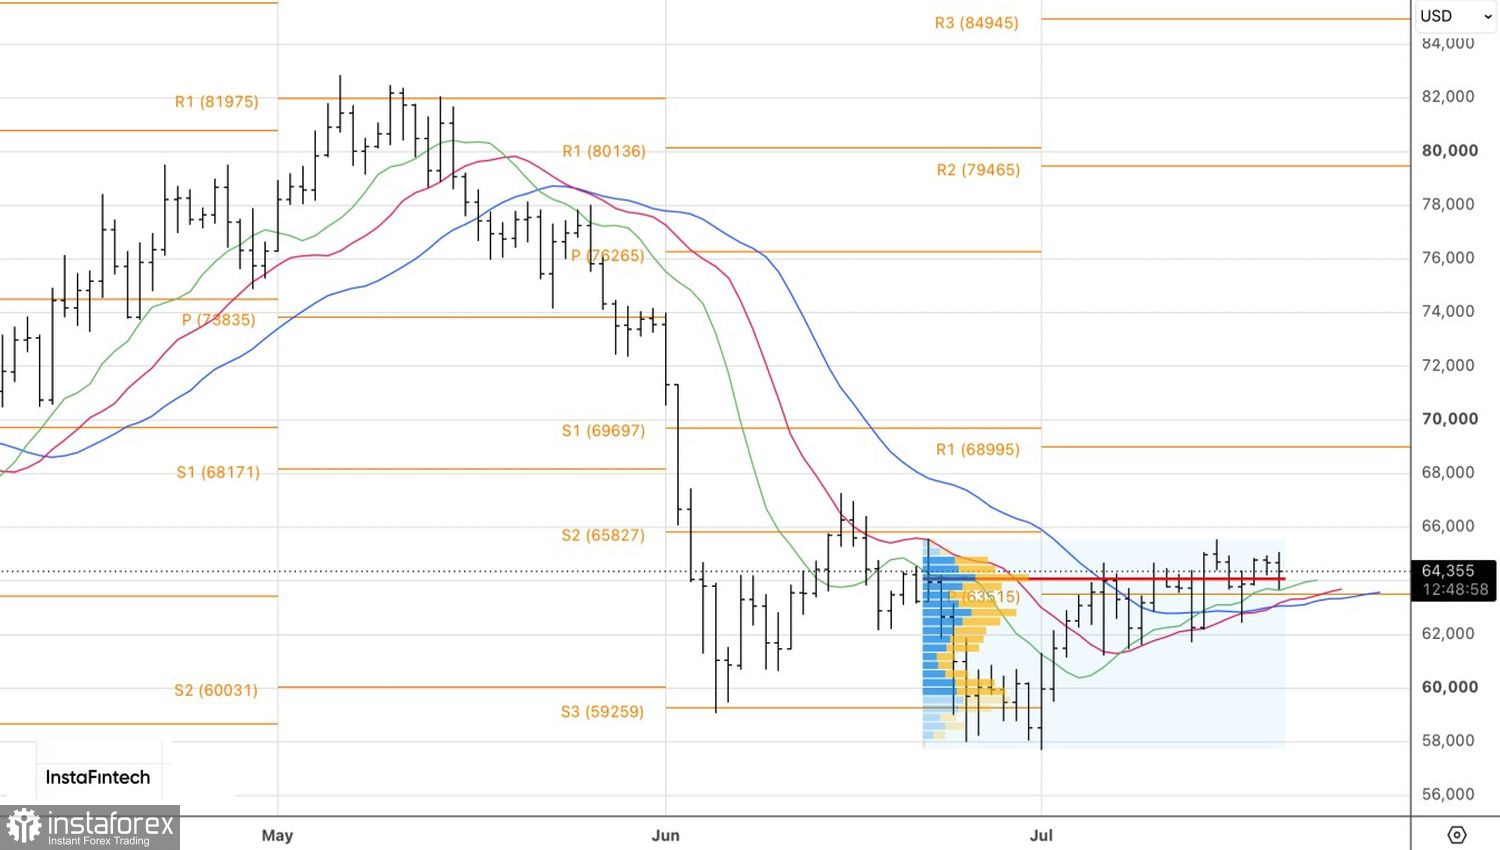
Technically, on the daily chart, BTC/USD remains consolidated in the $62,000–$65,000 range. A breakout of the upper band with a sustained close above would be a buy signal. Conversely, failure to hold fair value at $64,100 would be a worrying sign.


