
আরও দেখুন


 01.09.2026 07:48 AM
Bitcoin has risen a total of $18,000, but the rapid surge quickly came to a halt. This may be a pause — a calm before a new rally. Bitcoin often stops during strong trends and can show powerful movement without a correction. Therefore, Bitcoin's current inability to continue moving north does not signify the end of the "northern impulse." However, we want to note that neither Ethereum nor Bitcoin has yet broken their downward trends that began last year (the CHOCH lines remain unbroken on the daily timeframe). Thus, no matter how sharp and strong the current rise is, the proof will be seen in the fall. In any case, no trading signals have been generated in recent days, and all movement is just another pump. Essentially, a "bearish" trend is still in play.
Meanwhile, it has become known that crypto treasury companies have lost approximately $80 billion in capitalization since autumn 2025. Recall that at that time, Bitcoin was trading at record highs, so the stocks of companies built around Bitcoin investment also soared. However, much has changed since then. Despite the recent rise, Bitcoin is trading near average market purchase prices and close to the cost of mining. Financial Times estimates that the total capitalization of the 50 largest treasury companies has dropped from $150 billion to $67 billion. As a result, Bitcoin is declining, and so are the shares of the companies that are buying Bitcoin "with all their funds."
A vivid example of this is the company Strategy. Although its investment strategy has changed, it still holds about 4% of the total Bitcoin issuance. Thus, its Bitcoin holdings are valued at approximately $65 billion at current prices, while the company's total capitalization is about $50 billion. It is obvious that the company's fate now depends on the Bitcoin rate. If Bitcoin rises, the capitalization will also increase, as a growing number of investors will be eager to buy Strategy shares. Conversely, new declines in Bitcoin will trigger further sell-offs of the company's stock. Essentially, we see a classic example of putting all our eggs in one basket, which is widely considered a poor strategy.
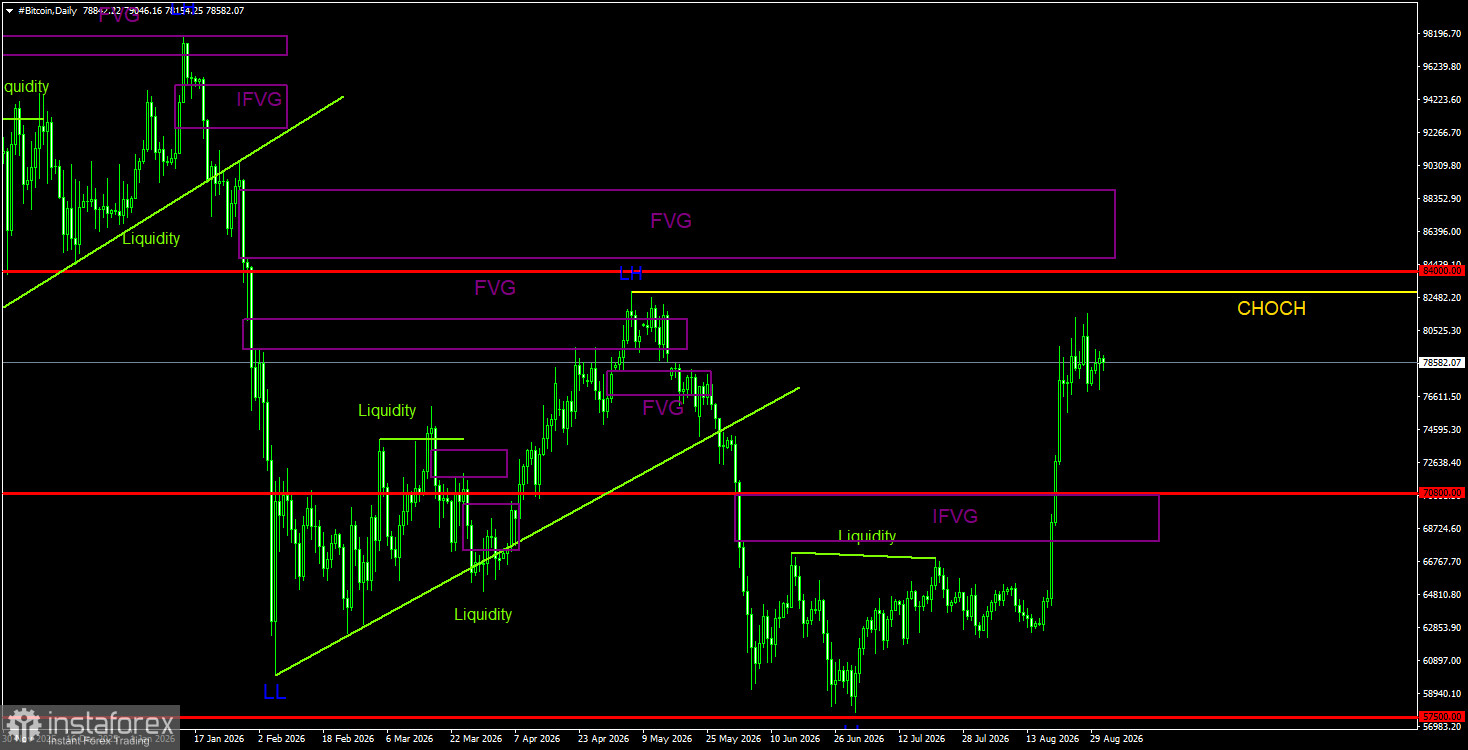
On the daily timeframe, Bitcoin continues to form a downward trend. The trend structure is bearish, and the CHOCH line is at $82,800, where the last Lower High (LH) formed. Only above this level can it be considered that the downward trend is complete. The last and only bearish FVG has been completely taken out and turned into a "bullish" IFVG. Thus, in the future, this area will be a Point of Interest (POI) for long positions. Bitcoin has not yet broken the downward trend, but the chances of completing the bearish trend have sharply increased over the last two weeks. However, there is a high probability of forming a range between $60,000 and $82,500. This means that the price may remove liquidity from the last LH and begin a new decline.
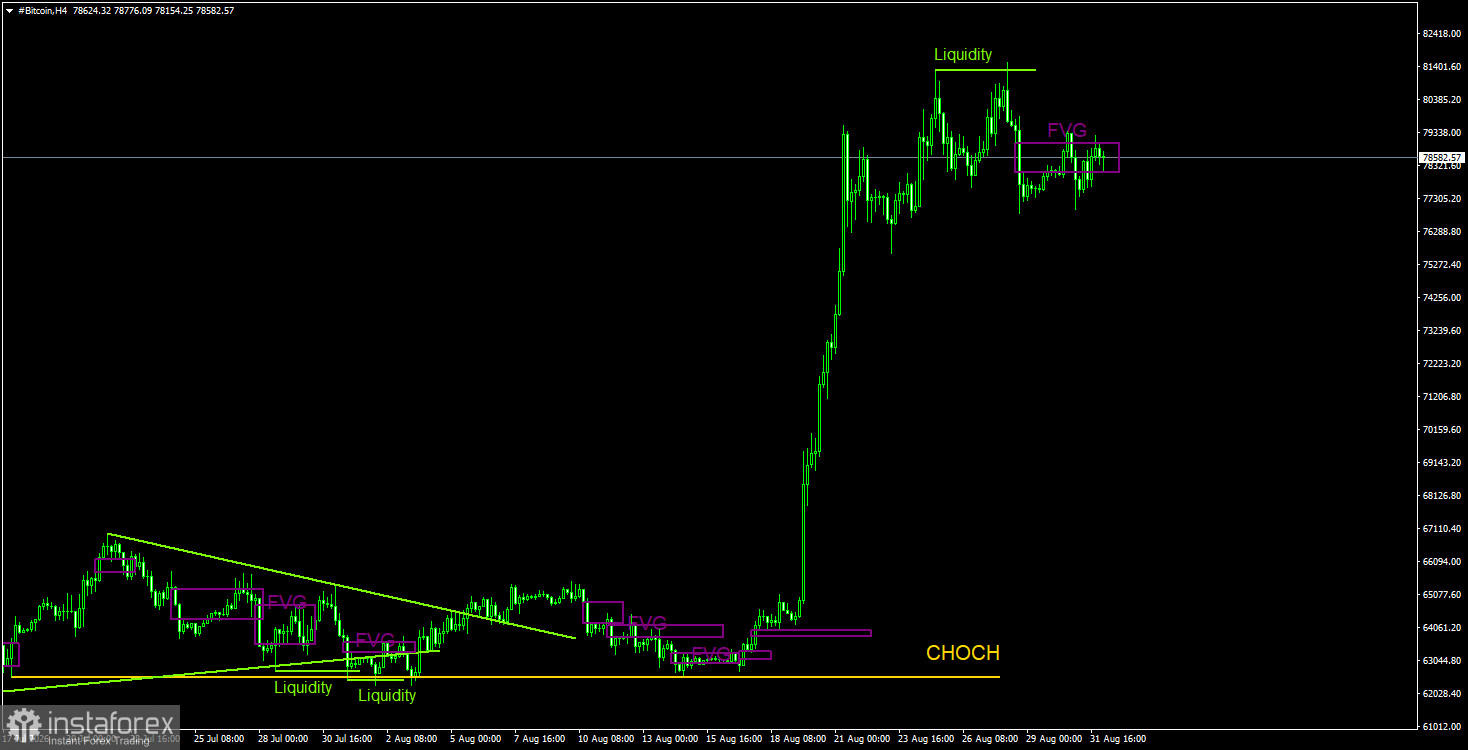
On the 4-hour timeframe, it is clear how Bitcoin literally shot up. Analyzing the 4-hour timeframe does not make much sense at this time, as the movements are too strong. Therefore, signals in the coming days should be sought on the daily or even weekly timeframe. However, one important point cannot be overlooked. Liquidity was taken from the last high, which may warn of an impending decline. The decline, as we can see, has already begun, but we cannot be sure it will be strong and prolonged. The only pattern worth noting on the 4-hour timeframe is the bearish FVG. If a downward impulse begins, a decline may resume from this pattern.
Bitcoin continues to form a downward trend despite the strong rise from the previous week. We continue to expect a decline, with a target of $57,500 (the 61.8% Fibonacci level of the three-year upward trend), although this level has already been tested. However, we do not believe the downward trend will end here. The current rise of the first cryptocurrency resembles a pump, but this is not a sufficient reason to open long positions. The current movement resembles a pump, with liquidity drawn from the $82,850 high, potentially triggering a decline in the first cryptocurrency and confirming a transition to sideways movement. On the 4-hour timeframe, a new round of decline can be expected from the last bearish FVG.
CHOCH — break of the trend structure.
Liquidity — Stop Loss, pending orders that market makers use to build their positions.
FVG — Area of price inefficiency. The price passes through such areas very quickly, indicating a complete absence of one side in the market. Subsequently, the price tends to return and react to such areas as it continues the main trend.
IFVG — Inverted area of price inefficiency. After returning to such an area, the price does not respond to it and impulsively breaks through it, then tests it from the other side.
OB — Order block. The candle on which the market maker opened a position to gather liquidity to form their position in the opposite direction.


