
আরও দেখুন


 12.11.2026 01:30 PM
Bitcoin is holding near $73,000 after an 8.5% weekly drop, and this is likely not the bottom as funds continue to pressure the market. On Wednesday, US spot Bitcoin ETF outflows rose to nearly $300 million from $95 million a day earlier, after three sessions of waning withdrawals.

That raises the question of whether the selling has run its course. Over five sessions, funds lost roughly $1.44 billion. The largest hit was to IBIT: BlackRock's fund saw $269.7 million redeemed, GBTC lost $39.1 million, while only Morgan Stanley's product attracted $9 million.
Wednesday's outflow is smaller than recent peaks — October 30 saw $643.2 million of redemptions (the largest daily outflow in October) and November 2 saw $399 million — but the cumulative effect is more important. By November 6, IBIT had lost about $1.44 billion over six consecutive sessions. Across nine sessions, the total exceeded $2 billion. The week of November 2–6 ended with $1.28 billion of outflows, the largest weekly withdrawal since late June, leaving year-to-date flows negative by roughly $919 million, and three additional outflow sessions have pushed that deficit deeper. I attribute the concentration of withdrawals in a single fund to large players cutting positions first, who need the most liquid vehicle.
The correlation picture with equities has also shifted. On November 5, Bitcoin fell with the Nasdaq 100 amid a correlation of 0.8, the highest since May 2022, but on Monday, the Nasdaq bounced by nearly 3%, while Bitcoin barely reacted. Equity gains without a corresponding move in Bitcoin indicate insufficient spot buyer interest.
To trigger a genuine reversal, we would need three consecutive inflow sessions and a reclaim above $75,500 — neither condition is present now, so I don't expect a sustained bounce yet.
Bitcoin
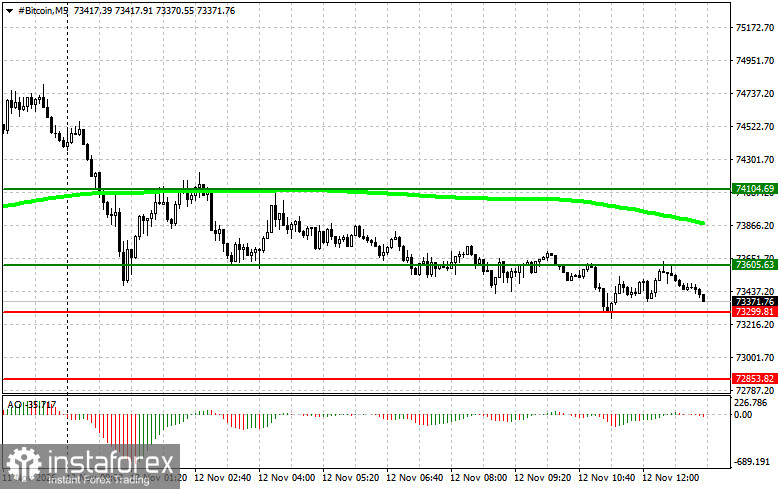
The current range is roughly 3,300–73,600, and the playbook covers two mirror scenarios with a full breakout and retreat contingencies. For long positions, the first scenario assumes a break above $73,600, targeting $74,100, where traders should lock in profit and consider a short position on a pullback, provided that the price is above the 50-day MA and the Awesome Oscillator is positive. The second scenario kicks in if a break below $73,300 fails and the price returns to the range. A rebound off $73,300 would be a buy signal, targeting $73,600 and then $74,100.
For short positions, the first scenario requires a confirmed break below $73,300, targeting $72,800, with the 50-day MA above the price and Awesome negative. If an upside breakout above $73,600 fails, a rebound from this level offers a short opportunity, aiming for $73,300 and then to $72,800.
Ethereum
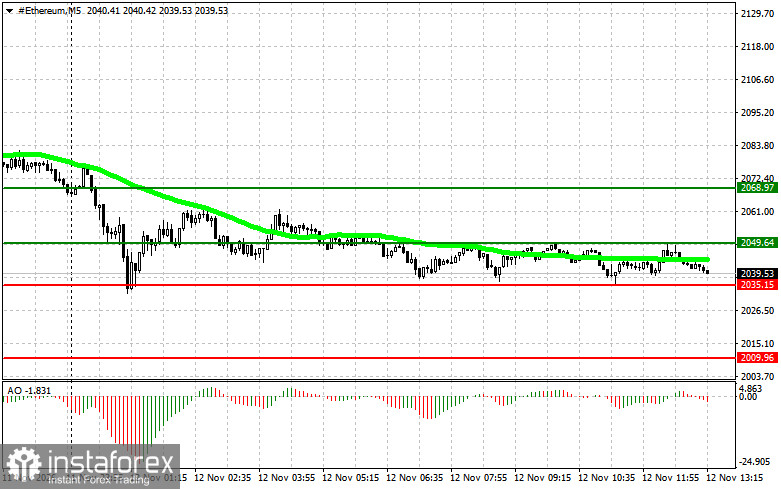
The logic mirrors Bitcoin's on its own price scale. The range is 2,035-2,049. Buy on a confirmed breakout above $2,049, targeting $2,068. Take profit there and consider a short position on a pullback, or buy on a rebound from $2,035 after a false break lower, targeting $2,049 and then $2,068. In both long setups, the price should be above the 50-day MA, and Awesome must be above zero.
Sell on a confirmed break below $2,035, targeting $2,009, with the 50-day MA above the price and Awesome negative, or go short on a false breakout above $2,049, aiming back to $2,035 and then $2,009. Both indicators act only as filters to screen false moves, not as standalone entry signals. Trades should be taken only after price confirmation at the specified levels.


