यह भी देखें

 18.02.2026 04:33 AM
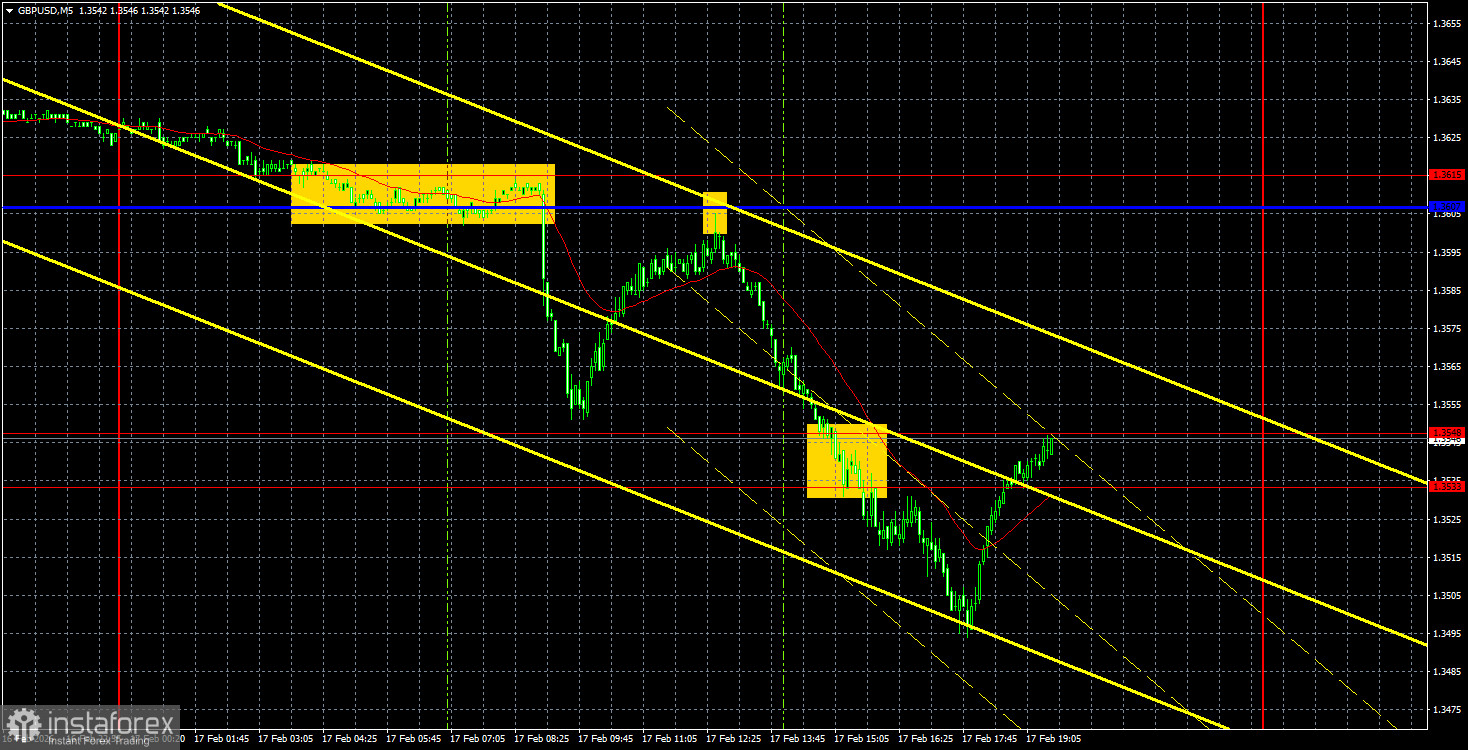
The GBP/USD pair declined sharply on Tuesday, falling like a rock, likely pulling the EUR/USD pair down as well. The only reason for selling the British currency was the UK's unemployment report. According to this report, the unemployment rate increased to 5.2%, which was unexpected for traders. The British pound faced a mass sell-off amid expectations of labor-market stimulus from the Bank of England.
Let's recall that the BoE could have cut its key rate in the previous meeting, but it fell just one vote short of a "dovish" decision. If the UK inflation report this morning shows a slowdown in line with forecasts, a rate cut at the next BoE meeting can be considered a done deal. At the same time, instead of further declines, the British pound might begin a new rise, as all "bearish" factors would have been factored in.
From a technical standpoint, a new local downtrend has been established, and the price is below the Ichimoku indicator's lines. We do not expect prolonged strengthening of the American currency, so we recommend waiting for the current trend to break before anticipating growth in the GBP/USD pair again.
On the 5-minute timeframe, three very good sell signals were formed yesterday. Volatility on Tuesday was sufficiently high, so the signals turned out to be profitable. At the beginning, the pair consolidated below the area of 1.3607-1.3615, then bounced off this area from below, after which it broke through the 1.3533-1.3548 range. Thus, traders could have opened a sell position in the area of 1.3607-1.3615 and closed it around 1.3533-1.3548.
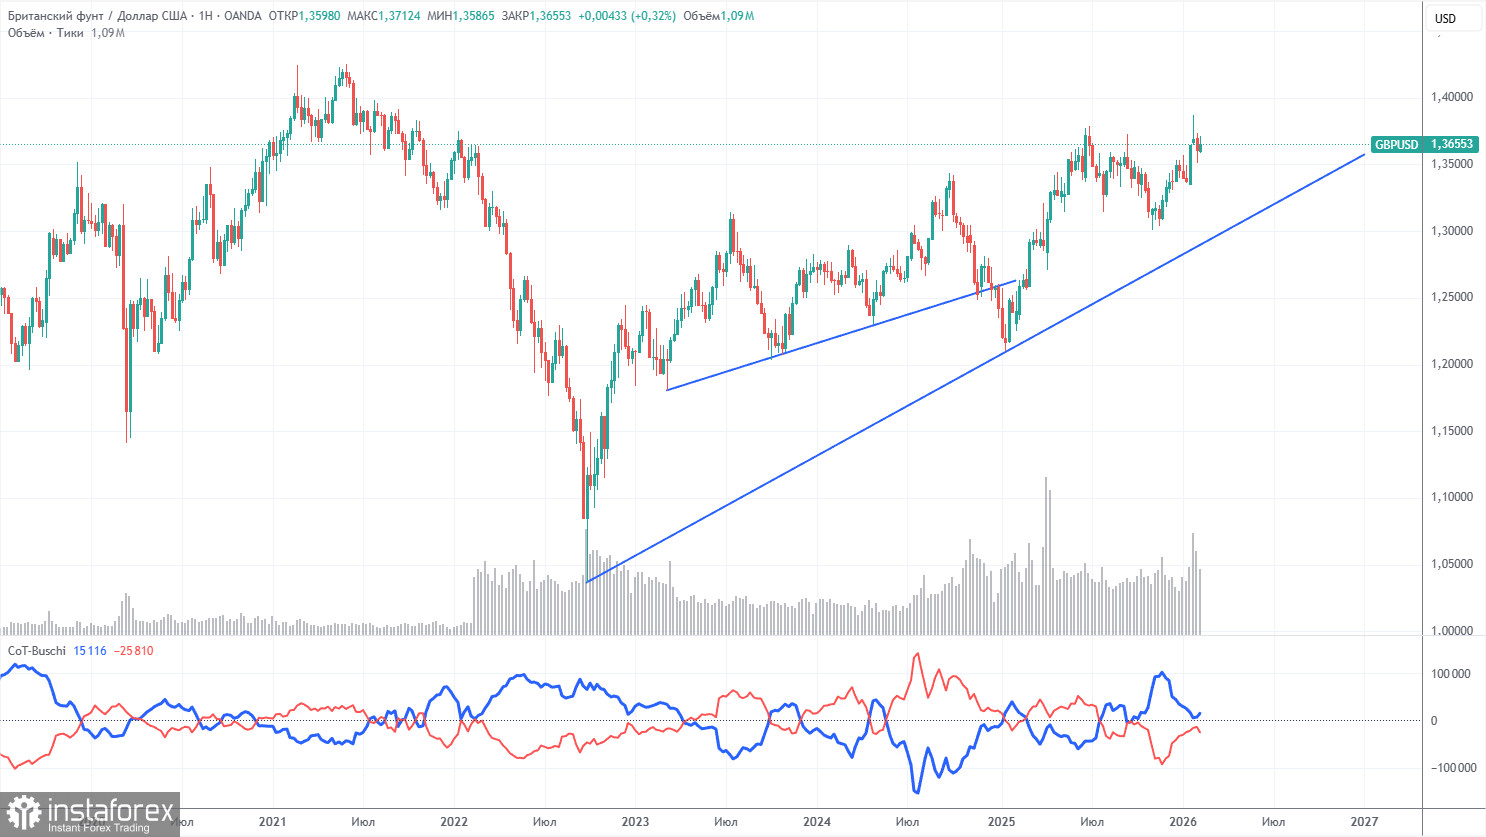
COT reports for the British pound show that, in recent years, sentiment among commercial traders has been constantly changing. The red and blue lines, representing the net positions of commercial and non-commercial traders, consistently cross and are mostly near the zero mark. Currently, the lines are coming closer together, with non-commercial traders still dominating with... sales. Recently, speculators have been actively increasing long positions, so a change in sentiment may soon occur, which does not particularly affect the GBP/USD pair.
The dollar continues to decline due to Donald Trump's policies, as shown clearly on the weekly timeframe (illustration above). The trade war will continue in one form or another for a long time, and the Federal Reserve will certainly lower rates in the next 12 months. Demand for the dollar will inevitably fall. According to the latest COT report (as of February 10) for the British pound, the "Non-commercial" group closed 6,500 BUY contracts and opened 5,300 SELL contracts. Thus, the net position of non-commercial traders decreased by 11,800 contracts over the week.
In 2025, the pound rose significantly, but it should be understood that this was solely due to Trump's policies. Once this reason is neutralized, the dollar may start to rise. But when that will happen, no one knows.
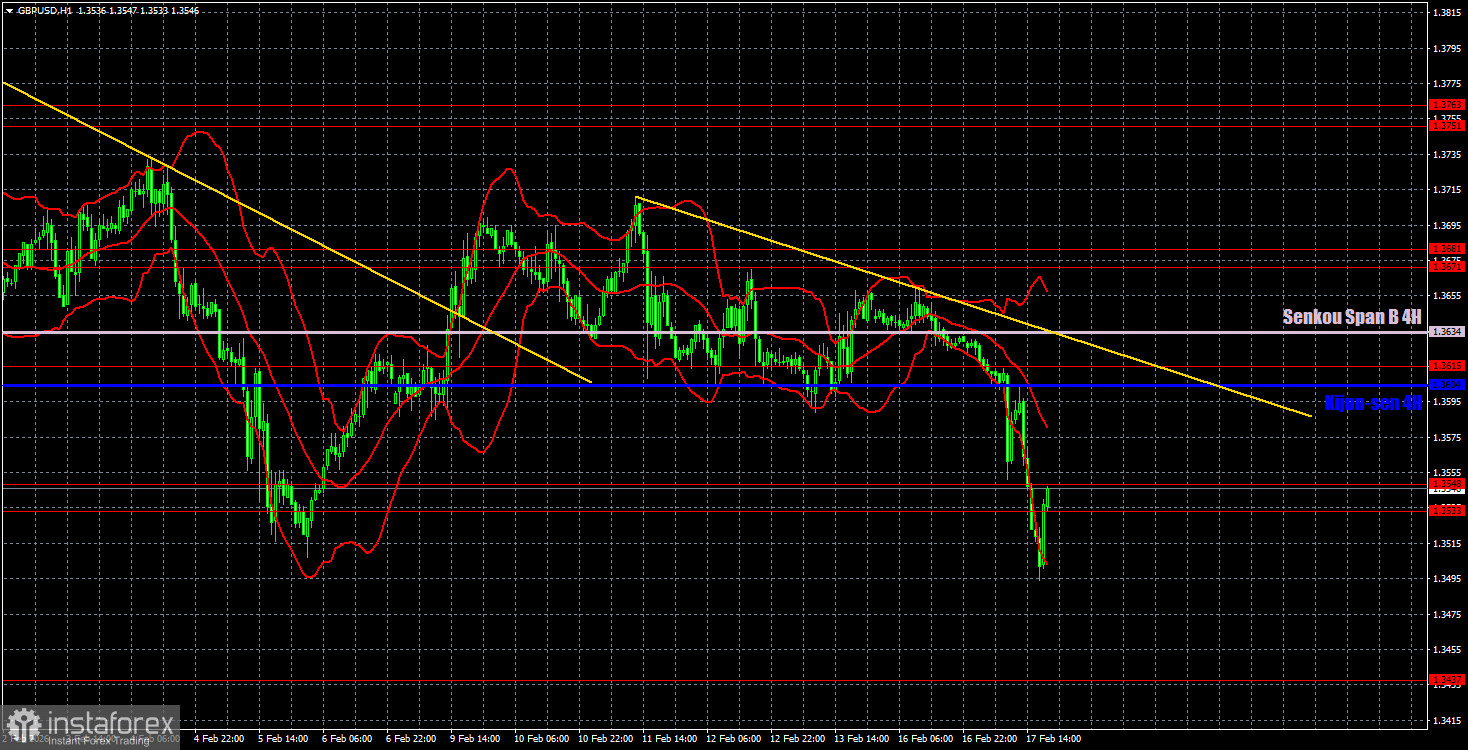
On the hourly timeframe, the GBP/USD pair has formed a new downward trend. Recent events have consistently hindered the British currency's growth or supported the dollar. The market has simply ignored certain data. We still believe that, in the medium term, the British pound will rise amid a weakening US dollar. However, at this time, the trend is downward, so we should wait for it to complete.
For February 18, we highlight the following important levels: 1.3201-1.3212, 1.3307, 1.3369-1.3377, 1.3437, 1.3533-1.3548, 1.3615, 1.3671-1.3681, 1.3751-1.3763, 1.3846-1.3886, 1.3948. The Senkou Span B line (1.3634) and the Kijun-sen line (1.3604) can also serve as signal sources. A Stop Loss level is recommended to be set to breakeven once the price moves 20 pips in the right direction. The Ichimoku indicator lines may move throughout the day, which should be taken into account when determining trading signals.
On Wednesday, a January inflation report is scheduled for publication in the UK, and it will likely answer the question of what decision the BoE will make at its next meeting. In the U.S., there are only a few reports of medium significance, including the durable goods orders report. Volatility during the day may be quite high.
Today, traders may consider short positions with a target of 1.3437 if the price bounces from the area of 1.3533-1.3548. Long positions will become relevant with a target of 1.3604-1.3634 if the price breaks above the 1.3533-1.3548 area.
Support and resistance levels – thick red lines around which movement may end. They are not sources of trading signals.
Kijun-sen and Senkou Span B lines – lines from the Ichimoku indicator transferred to the hourly timeframe from the 4-hour timeframe. They are strong lines.
Extreme levels – thin red lines from which the price has previously bounced. They are sources of trading signals.
Yellow lines – trend lines, trend channels, and any other technical patterns.
Indicator 1 on COT charts – the size of the net position of each category of traders.

