Triple Top
was formed on 13.06 at 02:00:45 (UTC+0)
signal strength 2 of 5
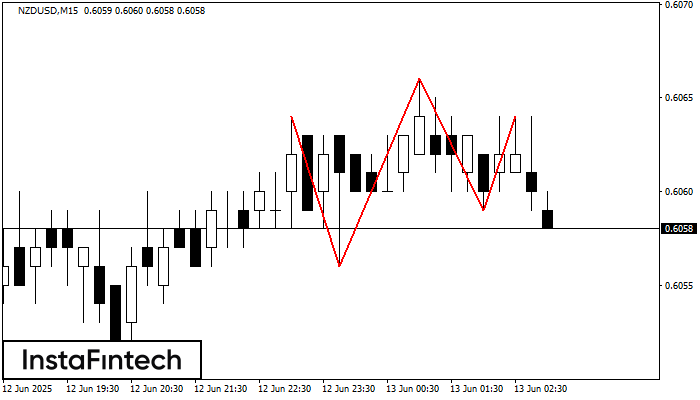
On the chart of the NZDUSD M15 trading instrument, the Triple Top pattern that signals a trend change has formed. It is possible that after formation of the third peak, the price will try to break through the resistance level 0.6056, where we advise to open a trading position for sale. Take profit is the projection of the pattern’s width, which is 8 points.
The M5 and M15 time frames may have more false entry points.
See Also
- All
- All
- Bearish Rectangle
- Bearish Symmetrical Triangle
- Bullish Rectangle
- Double Top
- Double Top
- Triple Bottom
- Triple Bottom
- Triple Top
- Triple Top
- All
- All
- Buy
- Sale
- All
- 1
- 2
- 3
- 4
- 5
बुलिश सिमेट्रिकल त्रिभुज
was formed on 14.07 at 15:30:47 (UTC+0)
signal strength 5 of 5
D1 के चार्ट के अनुसार, #TSLA से बुलिश सिमेट्रिकल त्रिभुज पैटर्न बना। विवरण: यह एक ट्रेंड जारी रहने का पैटर्न है। 367.40 और 269.16 क्रमशः ऊपरी और निचली सीमाओं के
Open chart in a new window
बुलिश सिमेट्रिकल त्रिभुज
was formed on 14.07 at 15:30:37 (UTC+0)
signal strength 5 of 5
D1 के चार्ट के अनुसार, #TSLA से बुलिश सिमेट्रिकल त्रिभुज पैटर्न बना। पैटर्न की निचली सीमा ने निर्देशांक 269.16/323.26 को स्पर्श किया जबकि ऊपरी सीमा 367.40/323.26 के पार गई। यदि
Open chart in a new window
बियरिश पताका
was formed on 11.07 at 21:00:55 (UTC+0)
signal strength 3 of 5
बियरिश पताका पैटर्न #NTDOY M30 चार्ट पर बना है। यदि पताका का 21.38 निम्न स्तर टूट जाता है, तो पैटर्न डाउनट्रेंड के जारी रहने का संकेत देता है। अनुशंसाएं: पैटर्न
Open chart in a new window