Ver también

 18.01.2022 09:50 AM
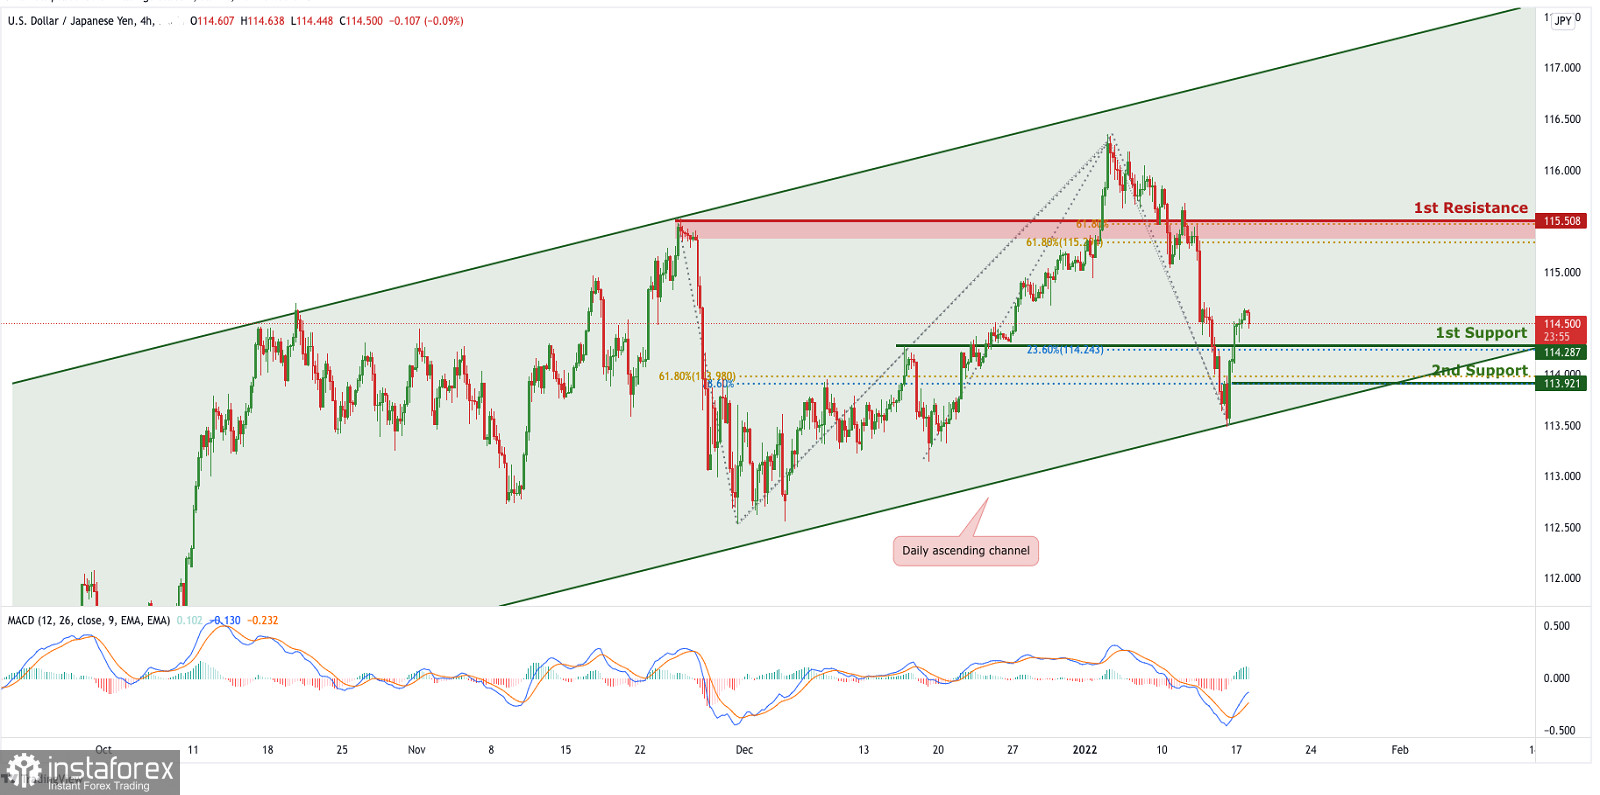
On the H4 timeframe, is abiding to the ascending channel on the daily, signifying an overall bullish momentum. We can now expect price to push higher from 1st Support in line with 23.6% Fibonacci retracement and graphical overlap support towards 1st Resistance in line with 61.8% Fibonacci projection and 61.8% Fibonacci retracement. Our bullish bias is further supported by the MACD indicator where the MACD line crossed above the signal line and both lines are in the oversold area.
Trading Recommendation
Entry: 114.508
Reason for Entry:Graphical overlap support, 23.6% Fibonacci retracement
Take Profit: : 115.508
Reason for Take Profit:61.58% FIbonacci retracement and 61.8% FIbonacci projection
Stop Loss: 113.921
Reason for Stop Loss:
78.6 Fibonacci projection, 61.8% Fibonacci retracement
You have already liked this post today
*El análisis de mercado publicado aquí tiene la finalidad de incrementar su conocimiento, más no darle instrucciones para realizar una operación.


