আরও দেখুন

 16.01.2026 11:50 AM
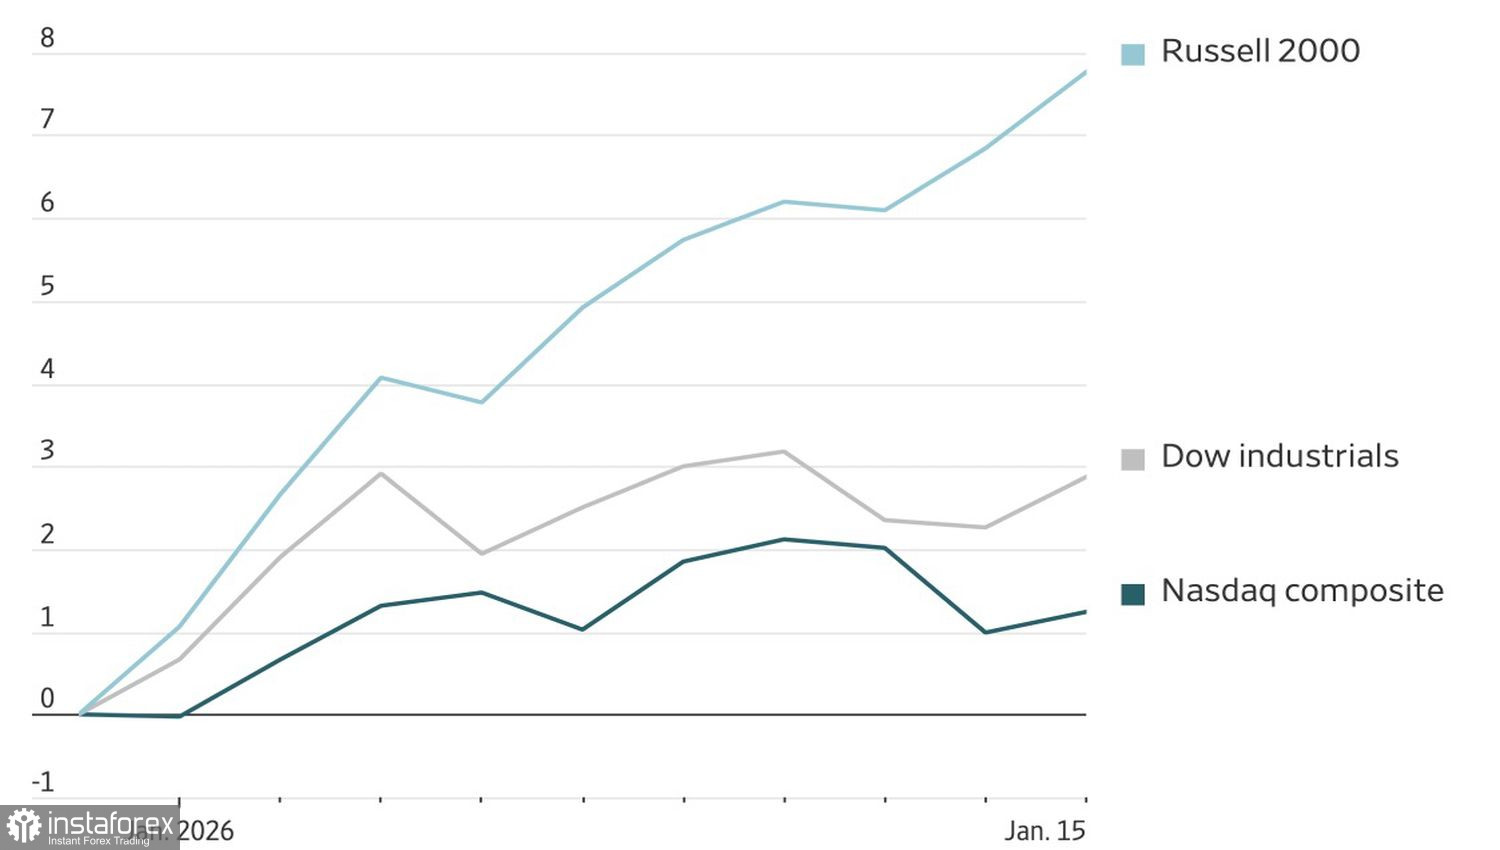
Rotation in the US equity market is gaining momentum. Since the start of the year, the small?cap Russell 2000 index has jumped by 8%, while the S&P 500 and Nasdaq Composite have gained only 1–2%. Still, should tech companies be treated as the main risk factor? Does it make sense to talk about a bubble by analogy with the dot?com crisis?
Dynamics of US Stock Indices
One of the main drivers of the shift from tech giants to economically sensitive US issuers has been concern that the Magnificent Seven will not be able to generate returns commensurate with massive investments.
Spending is indeed enormous, but only a wealthy, strong company can afford it. Moreover, investments have a positive effect on counterparties. In that respect, positive results from Asia's largest corporation TSMC led to gains in NVIDIA and other related US companies.
Taiwan Semiconductor Manufacturing announced $52–56 billion in capital expenditures, about a quarter more than in 2025. It forecasts revenue growth of 30% in 2026, exceeding Wall Street estimates.
Artificial intelligence technologies are thriving and generating higher profits than many other sectors — so why abandon them? The S&P 500 opened with a gap up and then fell, showing that investors quickly took profits after the tech giants' rally. They draw parallels with the dot?com crisis, when markets were infatuated with Internet companies and a bubble formed.
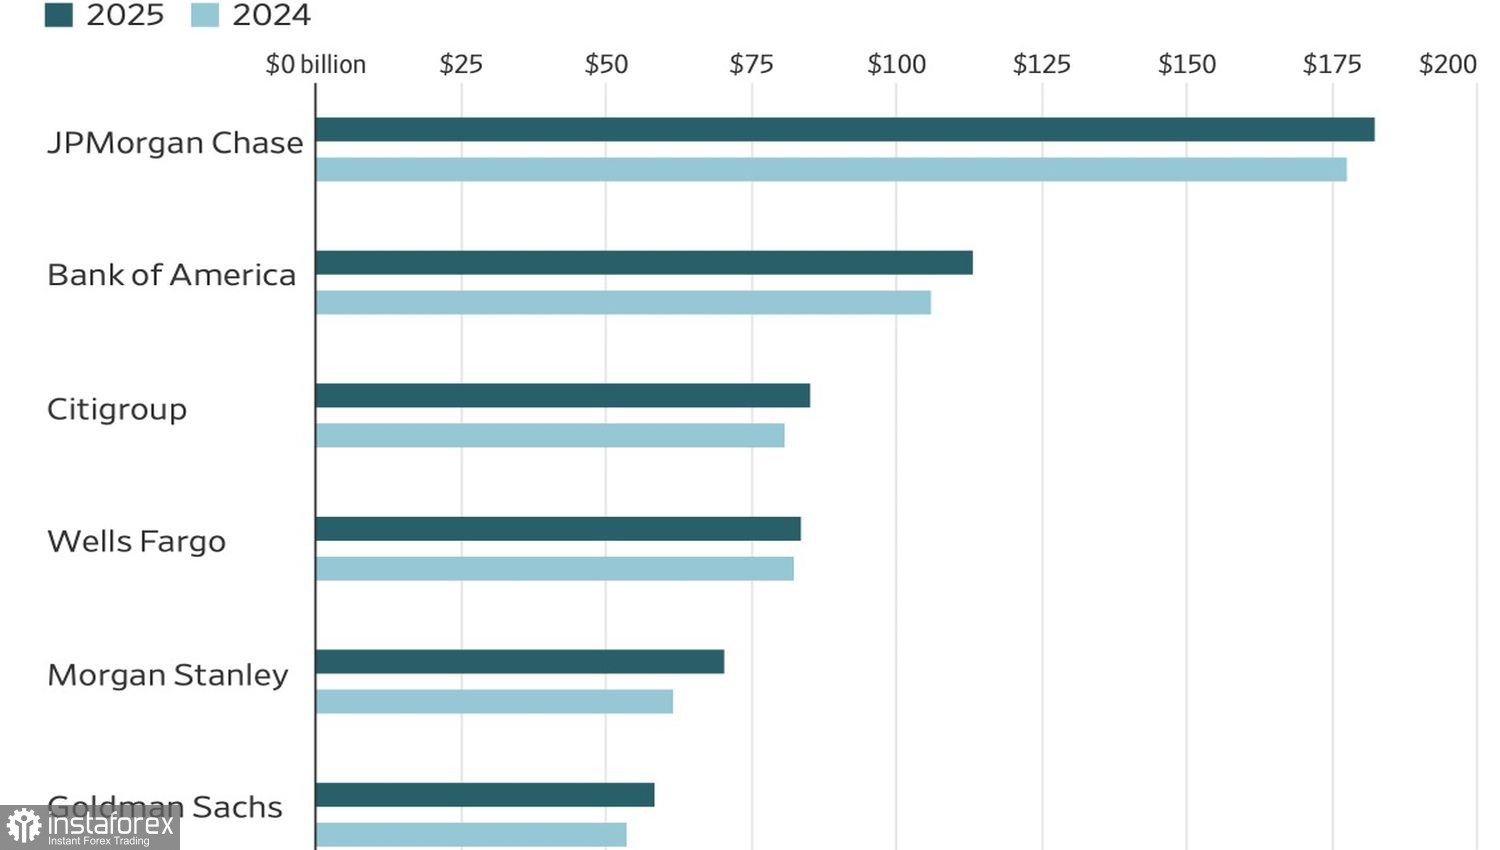
Despite disappointing bank earnings, their results for 2025 are impressive overall. Aggregate profits of the six largest US lenders rose by an impressive $187 billion, or 8%, the best showing since 2021.
Largest US Banks' Profit Dynamics
One reason for the rotation into small caps is the strength of the US economy. Inflation is slowing, though still far from the 2% target. The labor market is stabilizing. After the unemployment rate fell to 4.4%, good news came from initial jobless claims. Bloomberg economists forecast US GDP growth of 2% in 2026. The World Bank is even more optimistic.
In these conditions the Fed has no basis to cut the federal funds rate, and investors have reasons to buy stocks sensitive to the health of the US economy.
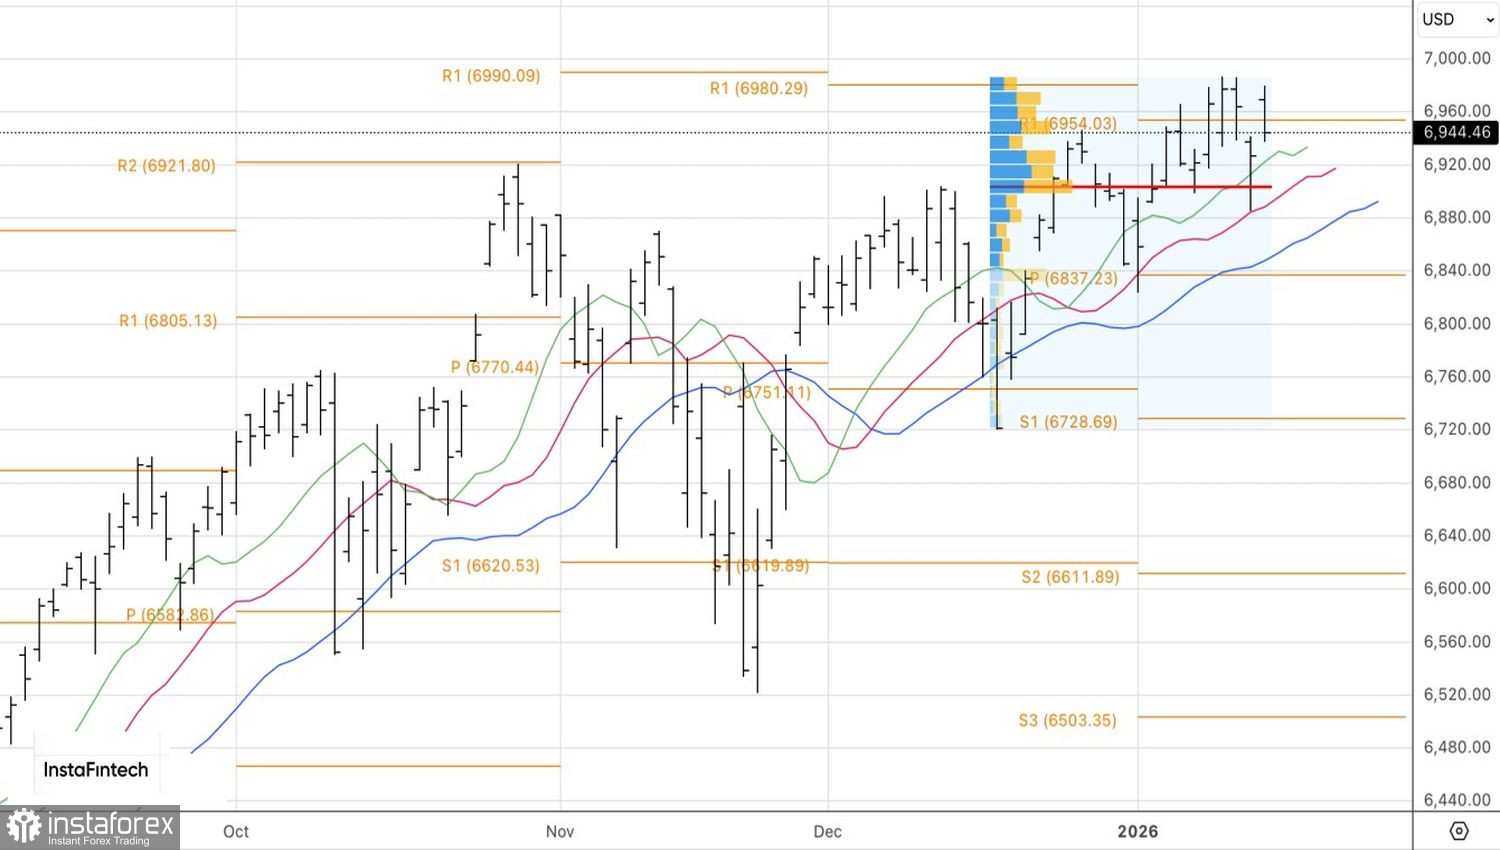
Technically, the daily chart shows that the S&P 500 experienced an opening price gap that was almost fully closed. Such a pattern typically signals bear strength. However, for sellers to regain control, the price must fall below the pivot level at 6,922 and fair value at 6,905. Conversely, successful assaults on resistance at 6,955 and 6,980 would provide grounds to go long.


