See also

 25.06.2025 07:36 AM
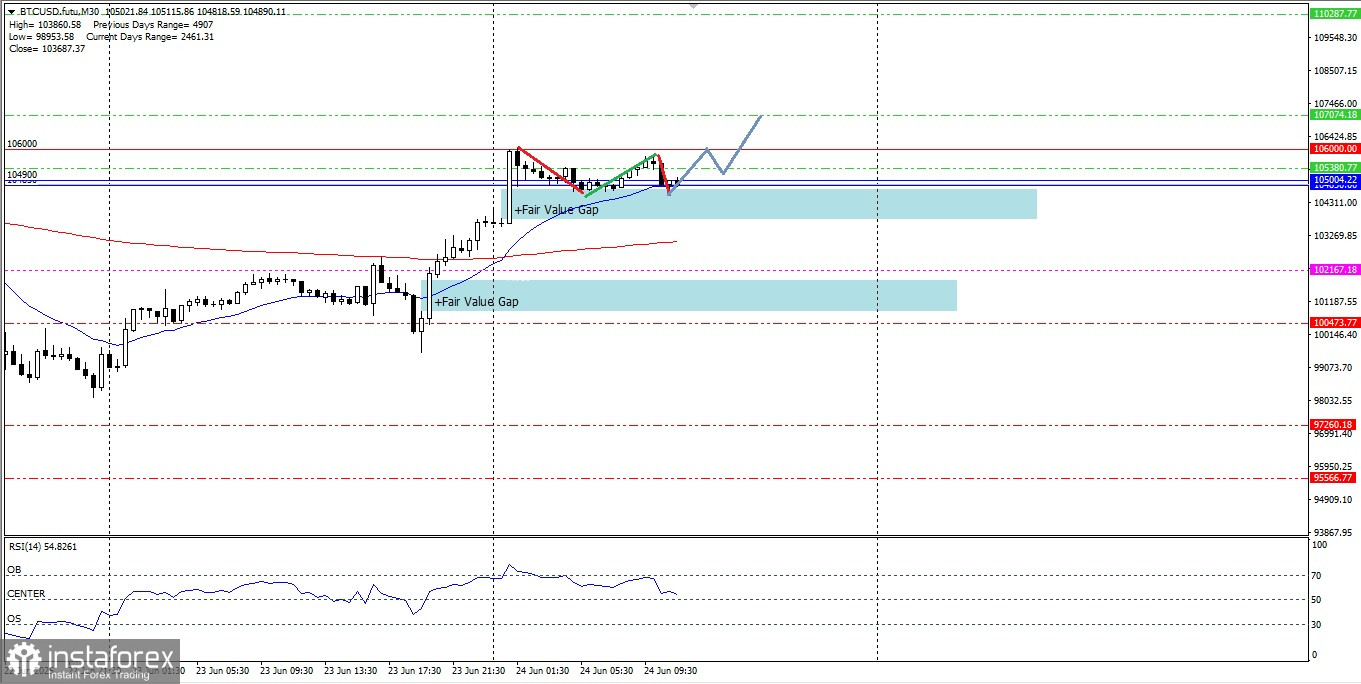
1. Market Sentiment Summary.
When yesterday President Trump softened his aggression against Iran, it eased the current world geopolitical tensions, causing several market players to start returning to risky assets such as the Bitcoin cryptocurrency, in addition to comments from several Federal Reserve officials who seemed to signal interest rate cuts in July also brought fresh air to the Bitcoin cryptocurrency.
2. Technical Analysis.
2.1. Important Levels :
Resistance. 3 : 110287.77.
Resistance. 2 : 107074.18.
Resistance. 1 : 105380.77.
PIVOT : 102167.18
Support. 1 : 100473.77.
Support. 2 : 97260.18.
Support. 3 : 95566.77.
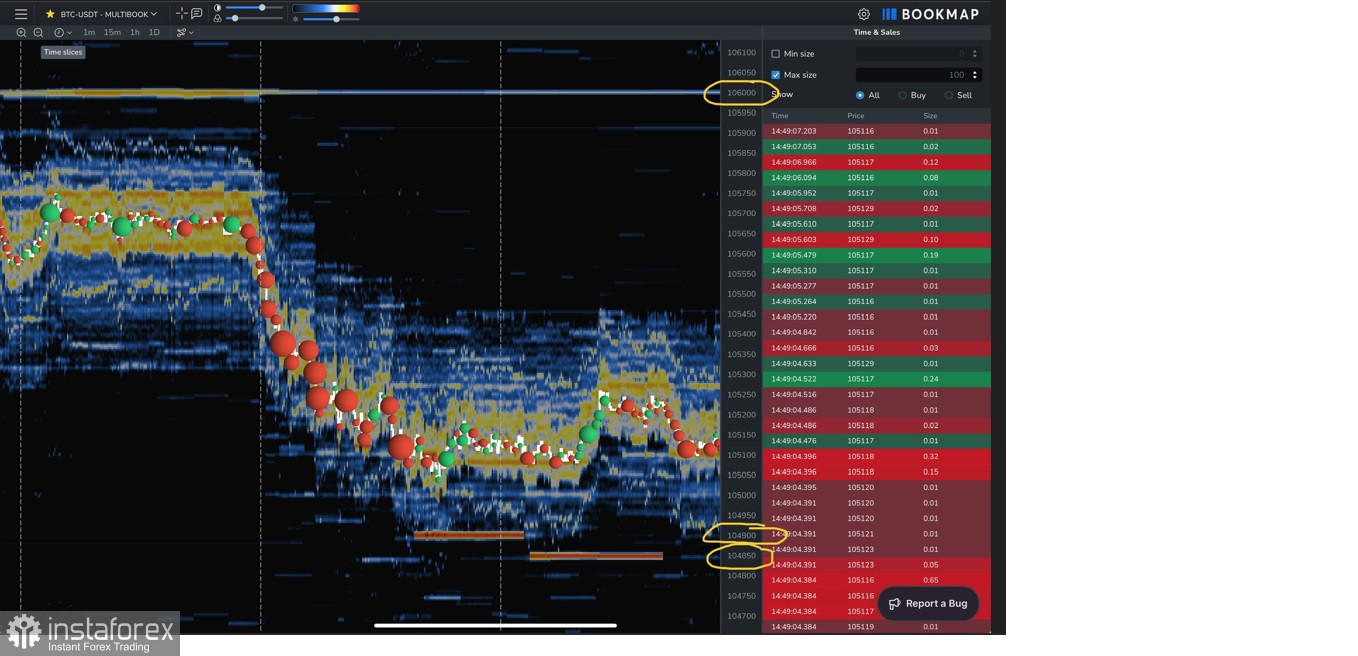
2.1.2. Liquidity Stop Level:
BUY Stop Level : 106000
SELL Stop Level : 104900 & 104850
2.1.3 Indicators :
EMA 50 : 102886.29 (Timeframe Daily).
EMA 200 : 93566.71 (Timeframe Daily).
Golden Cross Condition = Bullish Bias.
RSI (14) : 48.22 = Neutral but slightly depressed.
2.1.4. Chart & Candlestick Patterns:
On the Daily Chart there is a Descending Broadening Wedge pattern (Bullish Continuation) and yesterday's Candle formed a Bullish Engulfing pattern.
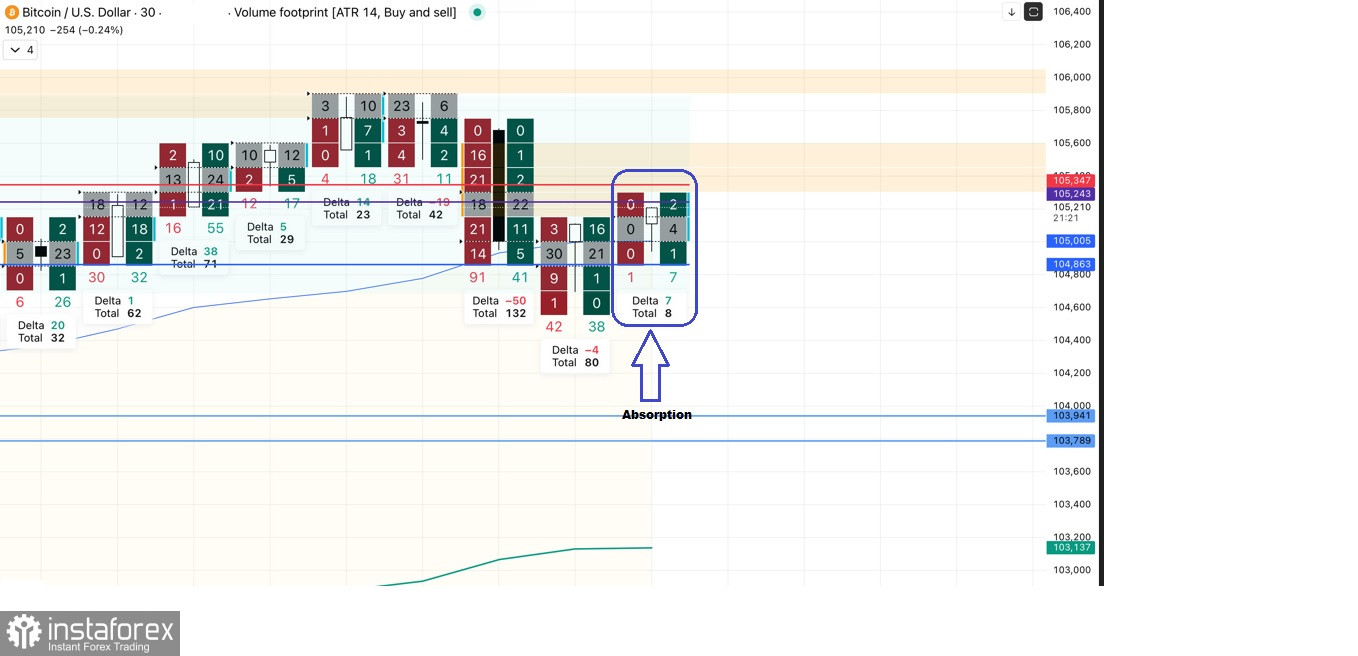
2.1.5 Footprint Chart.
From what is seen in the 30-minute Footprint Chart, it appears that there is a support area level formed from a collection of Footprint Chart Area value clusters and two Resistance area levels formed from two Imbalance Stacks (300%-3 levels) where one of them becomes the Resistance area level for BUY Stop Order liquidity at level 106000.

Although it is now stuck in the Value Area Low Season Volume Profile today (which acts as a support level) which also intersects with the upper Band of its weekly VWAP so that it is confirmed that the current downward correction is absorbed by Buyers "Absorption"
3. Technical Analysis View.
Based on the facts that have been described above, it seems that today Bitcoin will try to test the 106000 level if it successfully breaks through and closes above it if the volatility and momentum of its strengthening support it, then BTC/USD will continue to strengthen again to the Resistance level. 2 107074.18.
4. Conditions for canceling the View.
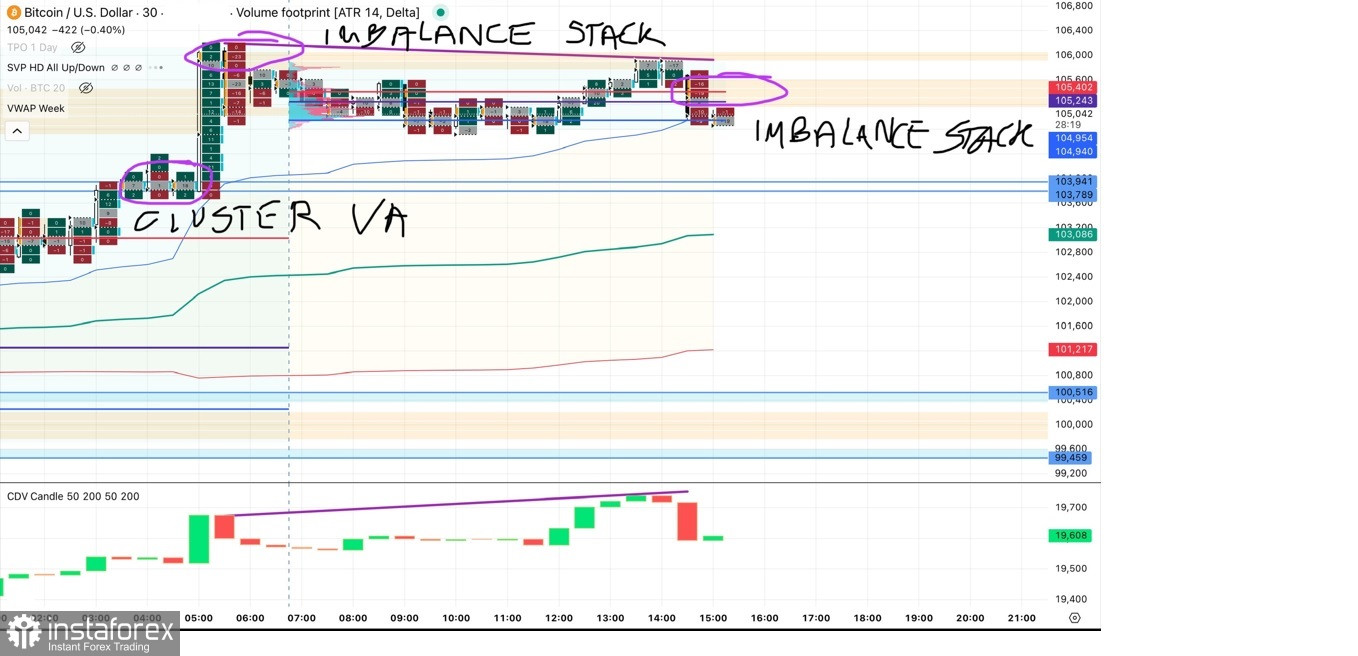
If we look at the Footprint m30 chart, a Hidden Divergence appears between the price movement and the Cumulative Delta Volume (CDV) indicator, so this condition also provides an indication that there is potential for BTC/USD to be corrected to weaken down if the correction continues, especially if it breaks through and closes below the level of 100442.99, then the strengthening scenario that has been described previously will be invalid and automatically canceled by itself.
5. Today's Economic Agenda:
5.1. CB Consumer Confidence (Jun) - 21:00 WIB.
5.2. Fed Chair Powell Testifies - 21:00 WIB.
6. Risk Notes.
This analysis is based on historical data and technical interpretation. There is no guarantee that the price movement pattern will repeat itself. Always use proper risk management.
7. Disclaimer.
This analysis is for educational purposes only and is not an investment recommendation or trading signal.


