empty
11.01.2022 09:00 AM
Technical analysis of Apple for January 11, 2022

This image is no longer relevant

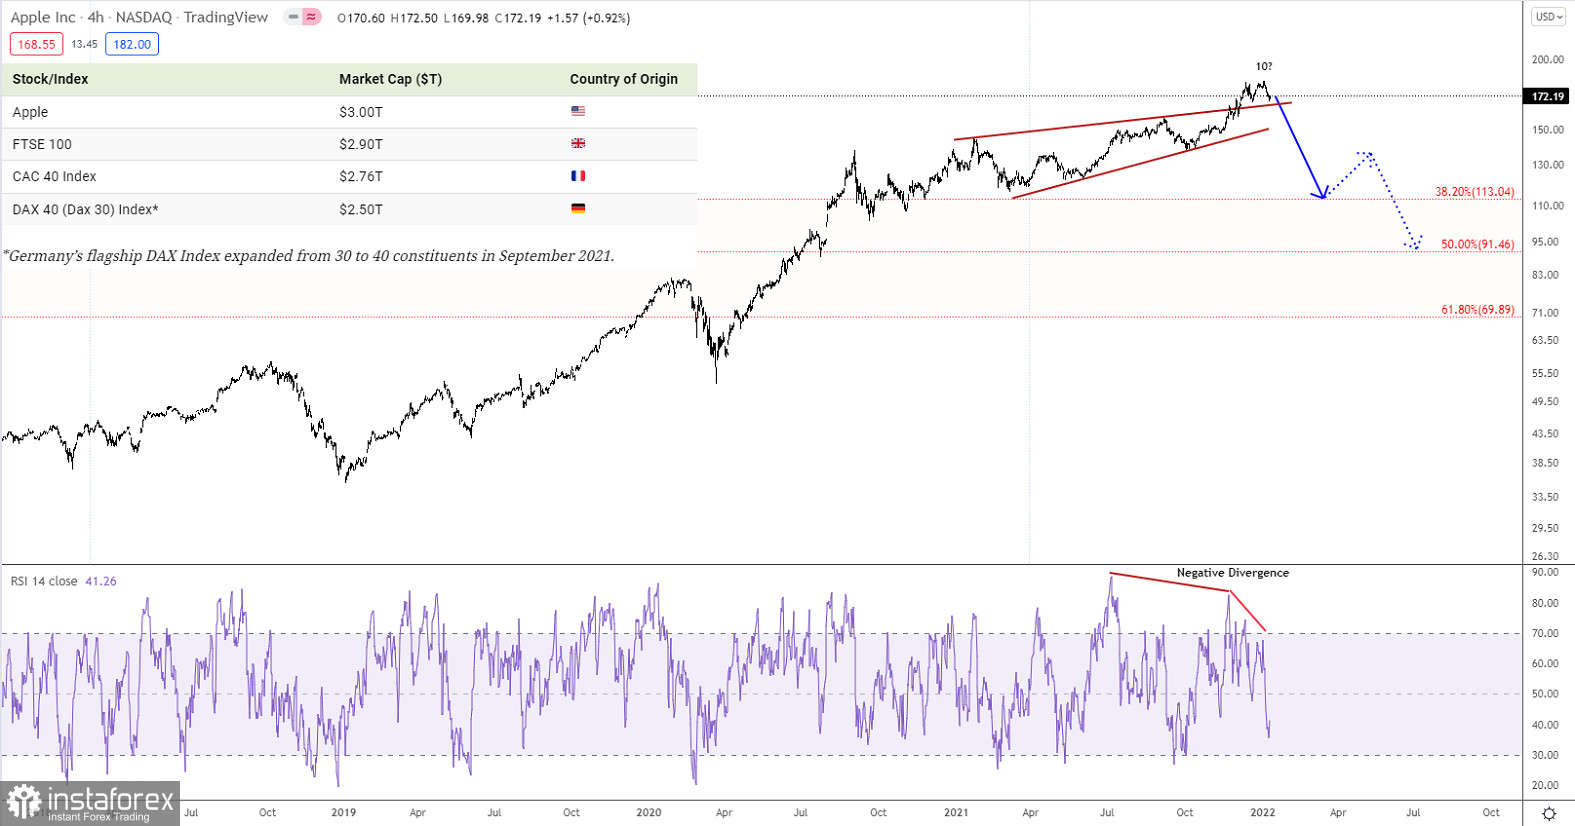
Apple shortly hit a market cap of USD 3 trillion, which is more than all stocks together in the FTSE 100 or the French CAC 40 or the DAX 40 each of these indices has a value below USD 3 trillion. We can't say if that valuation is extreme, but what we can say something about is the technical view for Apple and it should be clear that and ending diagonal or wedge is playing out here. This formation is seen at the end of a large rally or decline. In the case of Apple, it's after a large rally and this formation call for a decline to the start of the formation which is seen at 103.11 within half the time it took to build the ending diagonal. As it took 16 months to build the ending diagonal, it should take less than 8 months to bring Apple down to 103.11 once the top is confirm, which will be upon a break below support at 169.12.

Recommended Stories

Bitcoin: Dollar Strength Could Trigger a Downturn in the Crypto Market

Today, the market's main focus will be the release of the U.S. inflation report, which is expected to show not only a halt in the recent decline but the highest

Pati Gani 11:47 2025-06-11 UTC+2

EUR/USD. June 11th. The U.S. and China Agreed on Nothing

On Tuesday, the EUR/USD pair continued to move sideways between the levels of 1.1380 and 1.1454. A new rebound from the 61.8% Fibonacci retracement level at 1.1380 enabled another rise

Samir Klishi 11:12 2025-06-11 UTC+2

GBP/USD. June 11th. UK Unemployment and US Inflation

On the hourly chart, the GBP/USD pair continued its decline on Tuesday, consolidated below the 161.8% Fibonacci level at 1.3520, and rebounded from it from below. Thus, the decline

Samir Klishi 10:56 2025-06-11 UTC+2

Technical Analysis of Intraday Price Movement of AUD/JPY Cross Currency Pairs, Wednesday June 11, 2025.

From what is seen on the 4-hour chart, the AUD/JPY cross currency pair appears to have a Divergence between the AUD/JPY price movement and the Stochastic Oscillator indicator, so based

Arief Makmur 09:28 2025-06-11 UTC+2

Technical Analysis of Daily Price Movement of USD/IDR Exotic Currency Pairs, Wednesday June 11, 2025.

There are some interesting facts about USD/IDR at the moment, first the price movement of USD/IDR is moving below WMA (21), second the appearance of Bearish 123 pattern followed

Arief Makmur 09:28 2025-06-11 UTC+2

Trading Signals for BITCOIN (BTC/USD) for June 11-13: sell below $110,700 (21 SMA - 200 EMA)

Bitcoin is trading around 110,726, undergoing a technical correction after reaching 110,726, a level seen at the end of May. Bitcoin has formed a double top pattern, so we believe

Dimitrios Zappas 05:16 2025-06-11 UTC+2

Trading Signals for GOLD (XAU/USD) for June 11-14: 2025 sell below $3,340 (21 SMA - 7/8 Murray)

Early in the European session, gold is trading around 3,334, showing exhaustion, as it bounced above 3,300 during yesterday's American session. This price level for gold

Dimitrios Zappas 05:09 2025-06-11 UTC+2

EUR/USD Forecast for June 11, 2025

Yesterday, the US dollar attempted to push the euro below key technical support levels marked by the daily Balance and MACD indicator lines, but the euro withstood the pressure

Laurie Bailey 04:41 2025-06-11 UTC+2

GBP/USD Forecast for June 11, 2025

Yesterday's employment data from the UK for May showed an increase in the unemployment rate from 4.5% to 4.6%, along with a rise in jobless claims by 33,100

Laurie Bailey 04:41 2025-06-11 UTC+2

Silver Forecast for June 11, 2025

Over the past seven sessions, silver has made a significant upward move, yet the growth potential remains far from exhausted. The target at 38.500 — the upper boundary

Laurie Bailey 04:41 2025-06-11 UTC+2
Can't speak right now?
Ask your question in the chat.
 

Dear visitor,

Your IP address shows that you are currently located in the USA. If you are a resident of the United States, you are prohibited from using the services of InstaFintech Group including online trading, online transfers, deposit/withdrawal of funds, etc.

If you think you are seeing this message by mistake and your location is not the US, kindly proceed to the website. Otherwise, you must leave the website in order to comply with government restrictions.

Why does your IP address show your location as the USA?

  • - you are using a VPN provided by a hosting company based in the United States;
  • - your IP does not have proper WHOIS records;
  • - an error occurred in the WHOIS geolocation database.

Please confirm whether you are a US resident or not by clicking the relevant button below. If you choose the wrong option, being a US resident, you will not be able to open an account with InstaTrade anyway.

We are sorry for any inconvenience caused by this message.