See also

 16.11.2021 04:36 AM
EUR/USD 5M
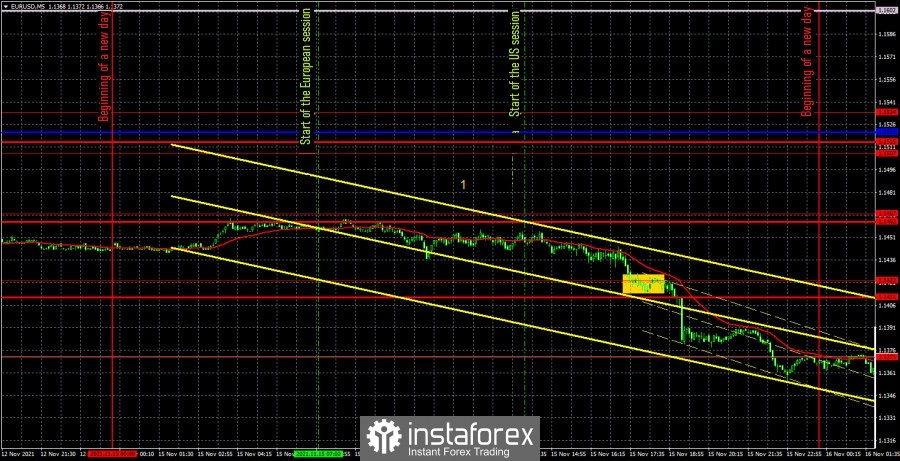
The EUR/USD pair continued to move in a mode close to flat during the first trading day of the week. However, a rather strong decline began in the second half of the day. In general, the pair continues to move "according to plan": 3-4 days with low volatility and almost complete absence of a trend, one day is more or less good. Traders could only turn their attention to European Central Bank President Christine Lagarde's speech in the European Parliament. However, Lagarde said only that the ECB does not plan to raise rates so as not to slow down the economic recovery. In addition, she noted that inflation may remain high for a longer period than previously expected. The markets have known all this for a long time and have heard it more than once. Therefore, they did not react in any way. As for trading signals, today a whole one has formed. It was formed already at a time when, in theory, the market should have been exited. In the middle of the US trading session, the price dropped to the extreme level of 1.1422, but for an hour after that it was impossible to even understand whether it had overcome it or rebounded. Later, the downward movement continued and the signal turned out to be very strong, but nevertheless it was formed too late to work it out. Consequently, no trade deal was opened on Monday.
EUR/USD 1H
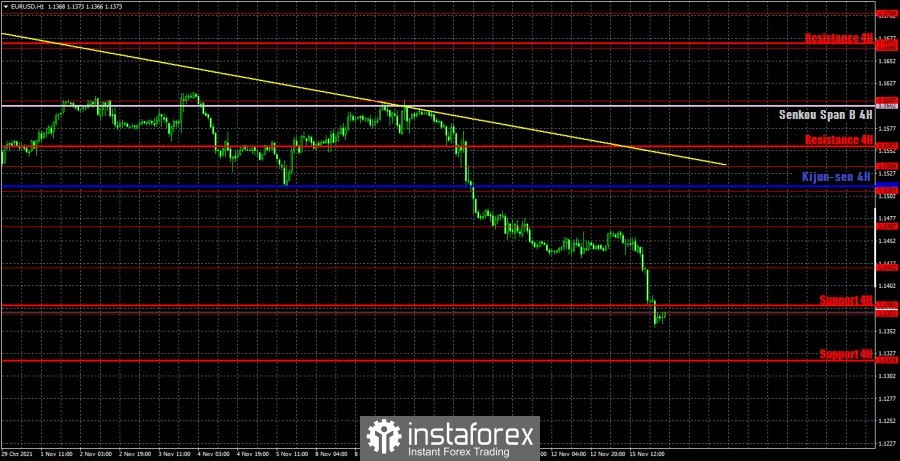
The downward trend continues on the hourly timeframe. Thus, selling is still more preferable, and the downtrend line lies far enough from the price. This means that almost any correction will maintain the current trend. The strengthening of the dollar has intensified in recent weeks, although in the last few days, the fundamental and macroeconomic backgrounds were practically not there. Nevertheless, the trend line continues to support the bears, and there are no reasons or signals for the end of the downward trend at this time. We highlight the following levels for trading on Tuesday - 1.1371, 1.1422, 1.1467, 1.1507, 1.1534, as well as the Senkou Span B (1.1602) and Kijun-sen (1.1512) lines. The Ichimoku indicator lines can change their position during the day, which should be taken into account when looking for trading signals. Signals can be rebounds or breakthroughs of these levels and lines. Do not forget about placing a Stop Loss order at breakeven if the price moves 15 points in the right direction. This will protect you against possible losses if the signal turns out to be false. Another speech by Lagarde will take place in the European Union on November 16, and the second estimate of the GDP for the third quarter will also be published. We do not expect anything extraordinary from either the first or the second event. A report on retail trade for October will be published in America, which, according to forecasts, may rise by 1.2% m/m, as well as a report on industrial production for the same period. We believe that the retail sales report will be of the greatest interest to the markets, but only if its actual value differs greatly from the forecast. Nothing more interesting is expected during the day.
We recommend you to familiarize yourself:
Overview of the EUR/USD pair. November 16. The dollar is growing 6 points a day on average. Christine Lagarde did not surprise the markets.
Overview of the GBP/USD pair. November 16. Scotland continues to voice its grudge against London's dependence.
Forecast and trading signals for GBP/USD for November 16. Detailed analysis of the movement of the pair and trade deals.
Analysis of the COT report
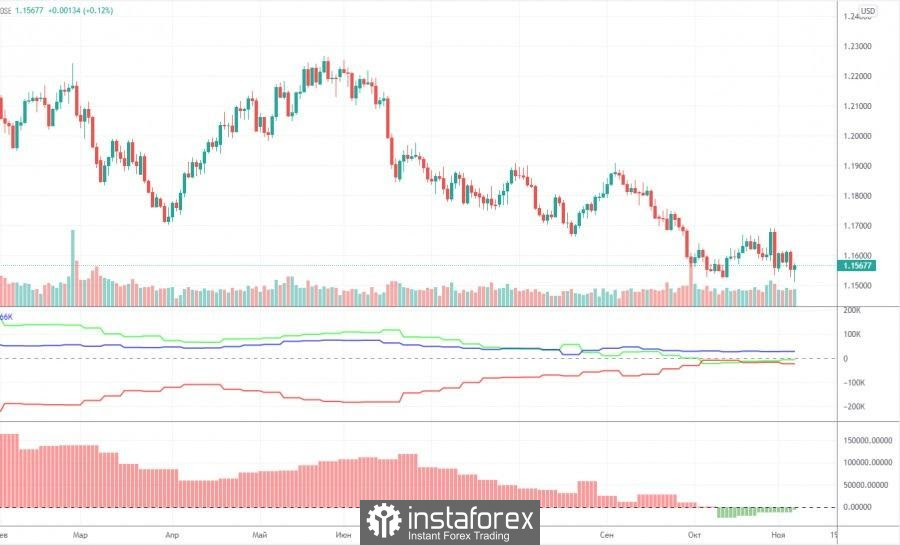
The mood of non-commercial traders changed, but not much, during the last reporting week (October 26-November 1). A group of "non-commercial" traders closed 4,000 buy contracts (longs) and 10.5 thousand sell contracts (shorts) during the reporting week. Consequently, the net position of professional players has grown by 6.5 thousand, which is not so much. However, the changes in the mood of non-commercial traders are best seen by the first indicator in the chart above. The red and green lines have been moving towards each other for a long time, and in the last couple of months they have been almost at the same level. This suggests that the previous trend is ending, and the mood of the major players at this time is as neutral as possible. This is confirmed by the data on the total number of contracts. The non-commercial group has 195,000 buy contracts (longs) and 199,000 sell contracts (shorts). The commercial group has 418,000 buy contracts and 442,000 sell contracts. That is, as we can see, the numbers are almost the same. Therefore, there are theoretical chances for the continuation of the downward movement in the pair. The trend began to end (an upward trend) when the red and green lines (net positions of the commercial and non-commercial groups) began to narrow. That is, for quite a long time. And now, logically, the downward trend continues. However, this "trend" is still not too similar to the trend. Rather, a banal three-wave correction.
Explanations for the chart:
Support and Resistance Levels are the levels that serve as targets when buying or selling the pair. You can place Take Profit near these levels.
Kijun-sen and Senkou Span B lines are lines of the Ichimoku indicator transferred to the hourly timeframe from the 4-hour one.
Support and resistance areas are areas from which the price has repeatedly rebounded off.
Yellow lines are trend lines, trend channels and any other technical patterns.
Indicator 1 on the COT charts is the size of the net position of each category of traders.
Indicator 2 on the COT charts is the size of the net position for the non-commercial group.


