empty
01.07.2022 10:40 AM
EUR/USD analysis and forecast for July 1, 2022

As a result, the first month of trading in the summer has ended. We must acknowledge that the primary currency pair EUR/USD finished on a rather sad note. The US dollar is still strong, as demonstrated at the June auction when it faced up against all except the Swiss franc's primary rivals. However, this is entirely another tale. And I recommend looking at the most senior timeframe and summarizing the month's outcomes that ended yesterday in today's article on the euro/dollar.

Monthly

This image is no longer relevant

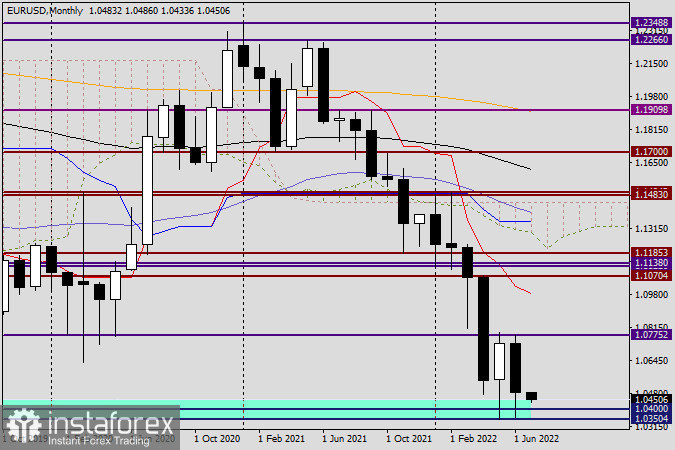
You will first notice the major support area near 1.0350, which is now indubitably historical. The fall, which had already been noticed in 2017, was stopped by this sturdy technical level, as is evident on the chart. I recall that occasion and how parity, or the level of 1.0000, was expected for the euro/dollar at that time. Instead, the pair took action, turned upward, and not only turned around but also grew decently, rising to the level of 1.2555. Following that, both ups and downs were seen in the price dynamics of the EUR/USD, and as a result of all these moves, the quote fell back to levels last seen five years ago. The relatively large shadows of the last two monthly candles amply illustrate the strength of the 1.0350 level. But nothing endures forever. Once more, I'd guess that the pair would indeed move quickly toward parity in the event of a true collapse of the 1.0350-1.0300 price range. The ending of July trading above 1.0775 will likely pave the way for higher prices, possibly even to the Tenkan red line, which is positioned at 1.0983, or to another significant historical and technical level of 1.1000. This is easy to predict, given the lows and highs of the previous month. If the July trades close at 1.0339 (the January 2017 lows), the pair will undoubtedly anticipate a route to the south, whose ferocity will only grow.

Daily

This image is no longer relevant

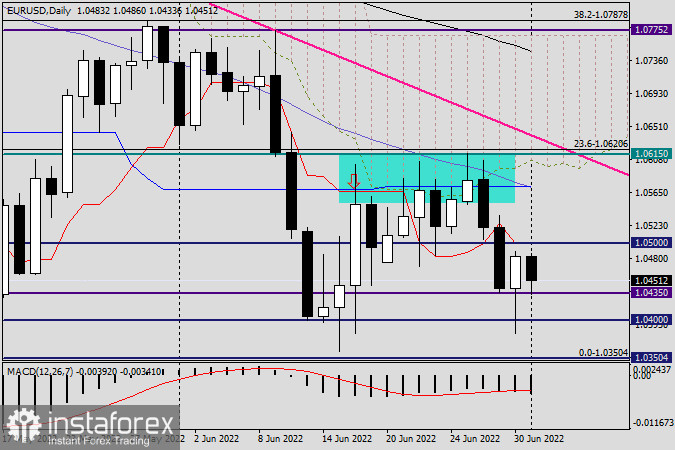
The EUR/USD pair displayed resilience throughout yesterday's trade. After attempting to breach another important key of 1.0400, it found firm support at 1.0383 and figuratively rose from the ashes to close Thursday's session at 1.0483. However, as the euro/dollar is currently trading below the red line of the Tenkan Ichimoku indicator, which is directly at this crucial level and the major psychological level of 1.0500, negative risks for the pair still exist. In this regard, it will be fascinating to see how the market will respond to today's eurozone inflation figures. I want to remind you that all versions of the eurozone consumer price index, including their base value, will be released at 10:00 London time. Since the European regulator has launched and postponed the issue of high inflation, I assume that the growth of consumer prices in the eurozone will be comparable to and, in some cases, even exceeding forecasts. This will support the single currency because it will be clearer that the ECB needs to turn its words into deeds. If technology is our only point of interest, then the bullish candle from yesterday with its lengthy lower shadow provides every reason to anticipate that the EUR/USD expansion may continue today. However, as is customary on the final trading day of the week, I won't provide any specific suggestions for trading. I assure you that this is not the ideal time.

Ivan Aleksandrov,
Analytical expert of InstaTrade
© 2007-2025

Recommended Stories

Forecast for EUR/USD on July 10, 2025

On Wednesday, the EUR/USD pair continued to move along a trajectory known only to itself. The 127.2% Fibonacci correction level at 1.1712 was once again ignored by traders. I still

Samir Klishi 12:21 2025-07-10 UTC+2

Forecast for GBP/USD on July 10, 2025

On the hourly chart, the GBP/USD pair continued its upward movement on Wednesday after rebounding from the 127.2% Fibonacci corrective level at 1.3527. The rebound was precise, leading

Samir Klishi 10:35 2025-07-10 UTC+2

GBP/JPY. Analysis, Forecast, and Current Market Situation

On Thursday, the GBP/JPY pair is regaining upward momentum and shows readiness for further growth. The formation of an ascending channel confirms the stability of the bullish trend. During

Irina Yanina 10:22 2025-07-10 UTC+2

If the resistance level of 0.7964 holds back its upward movement, USD/CHF has the potential to weaken on Thursday, July 10, 2025.

USD/CHF, Thursday, July 10, 2025 In addition to rumors of a planned Fed interest rate cut and falling US government bond yields, USD/CHF weakened today. Key Levels 1. Resistance

Arief Makmur 06:47 2025-07-10 UTC+2

Cable has the potential to test its Pivot and Support 1 levels in the near future, Thursday, July 10, 2025.

GBP/USD, Thursday, July 10, 2025. Rumors of the Fed's future dovish policy have created negative sentiment towards the USD, potentially helping the pound sterling strengthen again today. Key Levels

Arief Makmur 06:47 2025-07-10 UTC+2

EUR/USD Forecast for July 10, 2025

Markets continue to test risk-on strategies—yesterday, the S&P 500 rose by 0.61%, oil slipped by 0.22%, and the euro declined by just 4 points, which, given the low daily volatility

Laurie Bailey 06:14 2025-07-10 UTC+2

Trading Signals for GOLD (XAU/USD) for July 10-15, 2025: sell below $3,330 (21 SMA - 200 EMA)

If the bullish momentum prevails, we should buy gold above the 200 EMA located at 3,324. The outlook could be positive, with the price reaching 3,450 in the short term

Dimitrios Zappas 06:10 2025-07-10 UTC+2

Trading Signals for EUR/USD for July 10-15, 2025: sell below 1.1753 (200 EMA - +1/8 Murray)

Early in the European session, the euro is trading around 1.1737, above the 21 SMA and attempting to break the top of the downtrend channel formed since late June

Dimitrios Zappas 06:08 2025-07-10 UTC+2

GBP/USD Forecast for July 10, 2025

The British pound is slowly approaching the target resistance at 1.3635. A breakout above this level would open the way to the MACD line at 1.3705. This target is likely

Laurie Bailey 05:53 2025-07-10 UTC+2

AUD/USD Forecast for July 10, 2025

AUD/USDOn the daily chart, the Marlin oscillator continues its prolonged movement along the neutral zero line. As the price breaks through new local resistance or support levels, it encounters

Laurie Bailey 05:42 2025-07-10 UTC+2
Can't speak right now?
Ask your question in the chat.
 

Dear visitor,

Your IP address shows that you are currently located in the USA. If you are a resident of the United States, you are prohibited from using the services of InstaFintech Group including online trading, online transfers, deposit/withdrawal of funds, etc.

If you think you are seeing this message by mistake and your location is not the US, kindly proceed to the website. Otherwise, you must leave the website in order to comply with government restrictions.

Why does your IP address show your location as the USA?

  • - you are using a VPN provided by a hosting company based in the United States;
  • - your IP does not have proper WHOIS records;
  • - an error occurred in the WHOIS geolocation database.

Please confirm whether you are a US resident or not by clicking the relevant button below. If you choose the wrong option, being a US resident, you will not be able to open an account with InstaTrade anyway.

We are sorry for any inconvenience caused by this message.