See also

 20.03.2023 10:45 AM
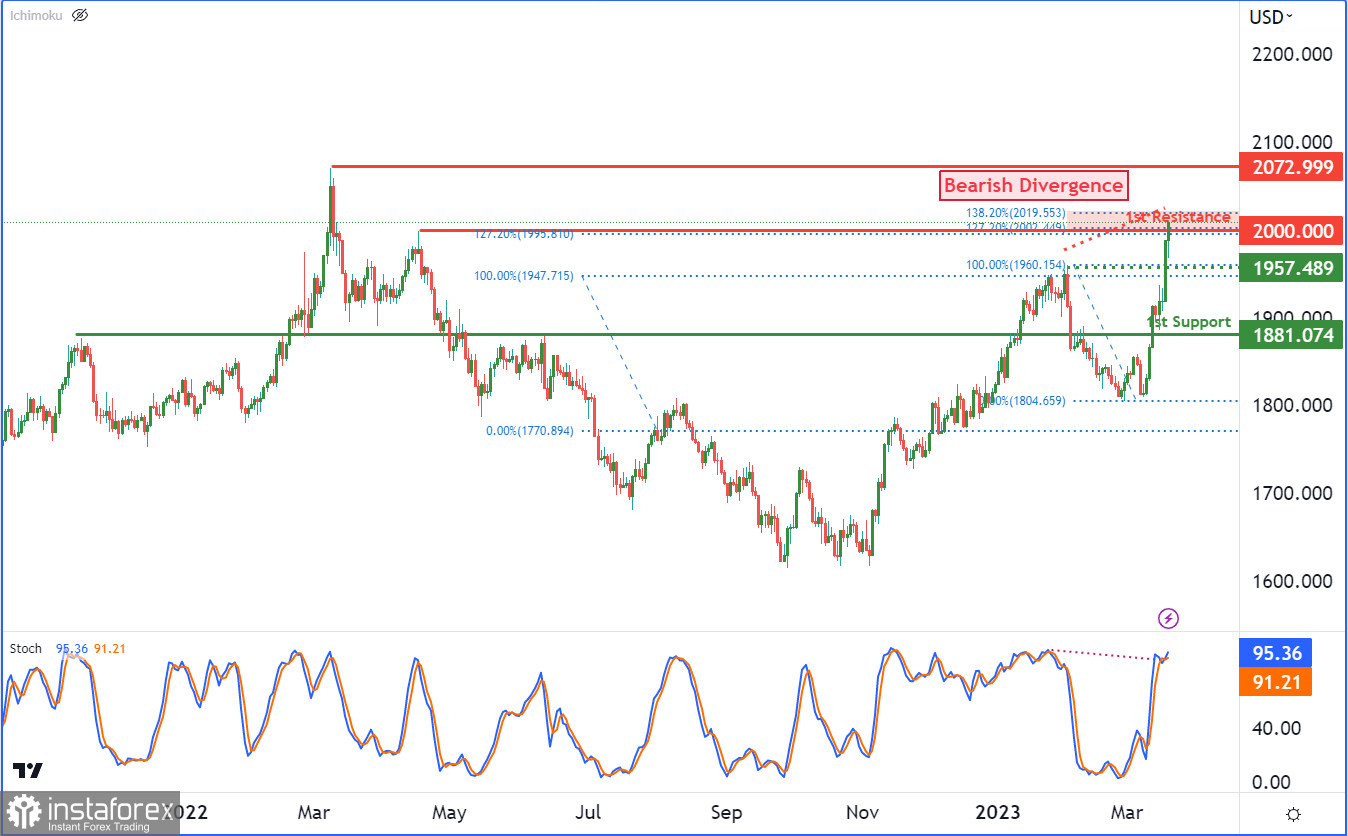
Gold prices have been experiencing a bearish trend for some time now, which is reinforced by a major descending trend line on the XAU/USD chart. The current price could potentially move between the first support and resistance levels. The first support level is a multi-swing low support at 1881, while the first resistance level is an important swing high resistance level at 2000. A break below the support level could lead to a further bearish trend towards the intermediate support level at 1957. Conversely, a break above the resistance level could push the price towards the second resistance level at 2072. Additionally, the Stochastic indicator is showing bearish divergence versus price, indicating a possible reversal soon and adding to the overall bearish sentiment.
You have already liked this post today
*The market analysis posted here is meant to increase your awareness, but not to give instructions to make a trade.


