See also

 20.03.2023 10:46 AM
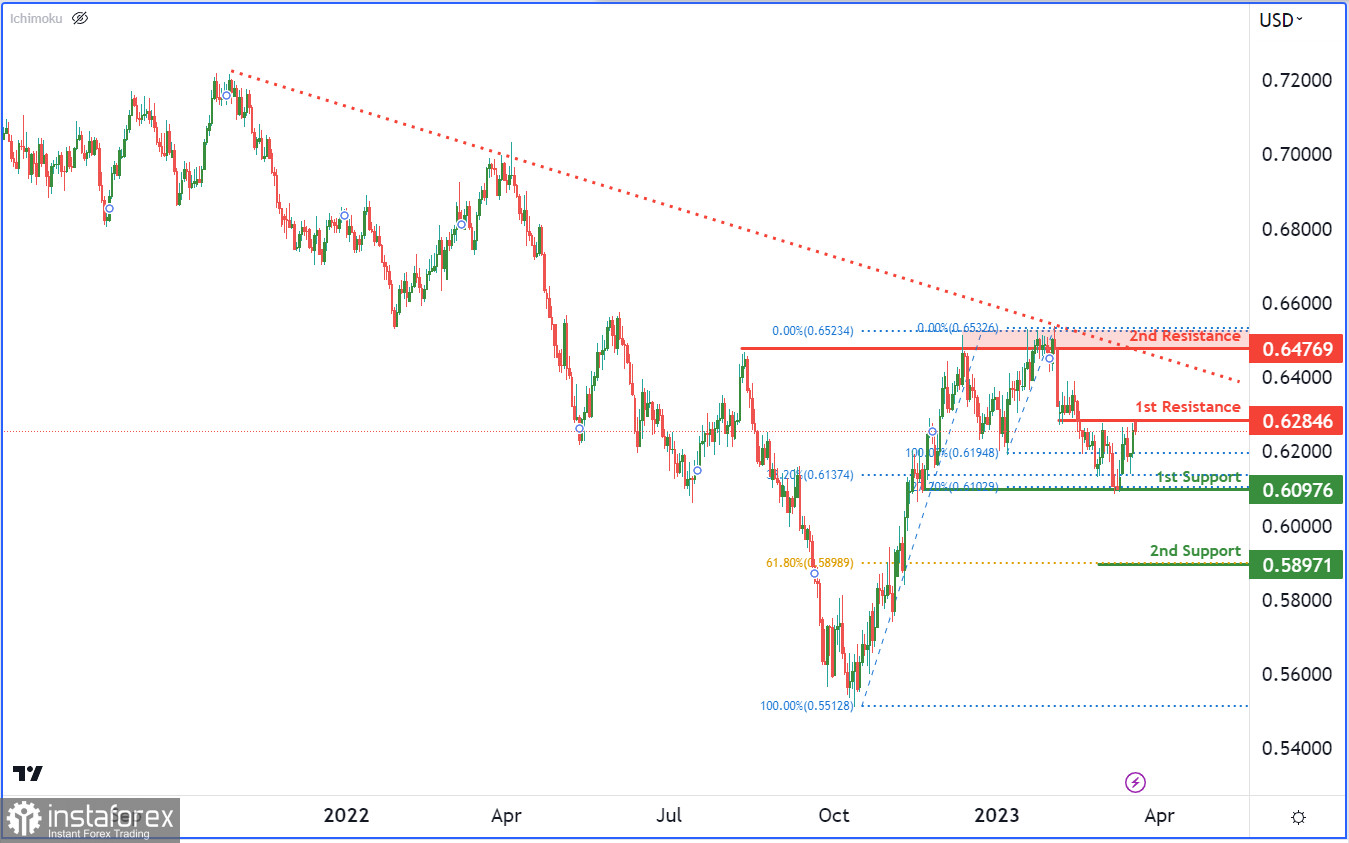
The NZD/USD chart currently displays a bearish momentum, with price below a major descending trend line and the bearish Ichimoku cloud. The potential price movement could involve a bearish reaction off the 1st resistance, leading to a drop towards the 1st support level.
At 0.6097, the 1st support level is a strong overlap support that lines up with the 38.20% Fibonacci retracement. If price drops below this level, the next support level it could reach is the 2nd support at 0.5897, which is a swing low support that has a 61.80% Fibonacci retracement lining up with it.
Alternatively, if price bounces from the 1st support level, it could rise to the 1st resistance level at 0.6284, which is a pullback resistance. Beyond that, the 2nd resistance level at 0.6476 is a significant multi-swing high resistance.
You have already liked this post today
*The market analysis posted here is meant to increase your awareness, but not to give instructions to make a trade.


