See also

 21.03.2023 08:53 AM
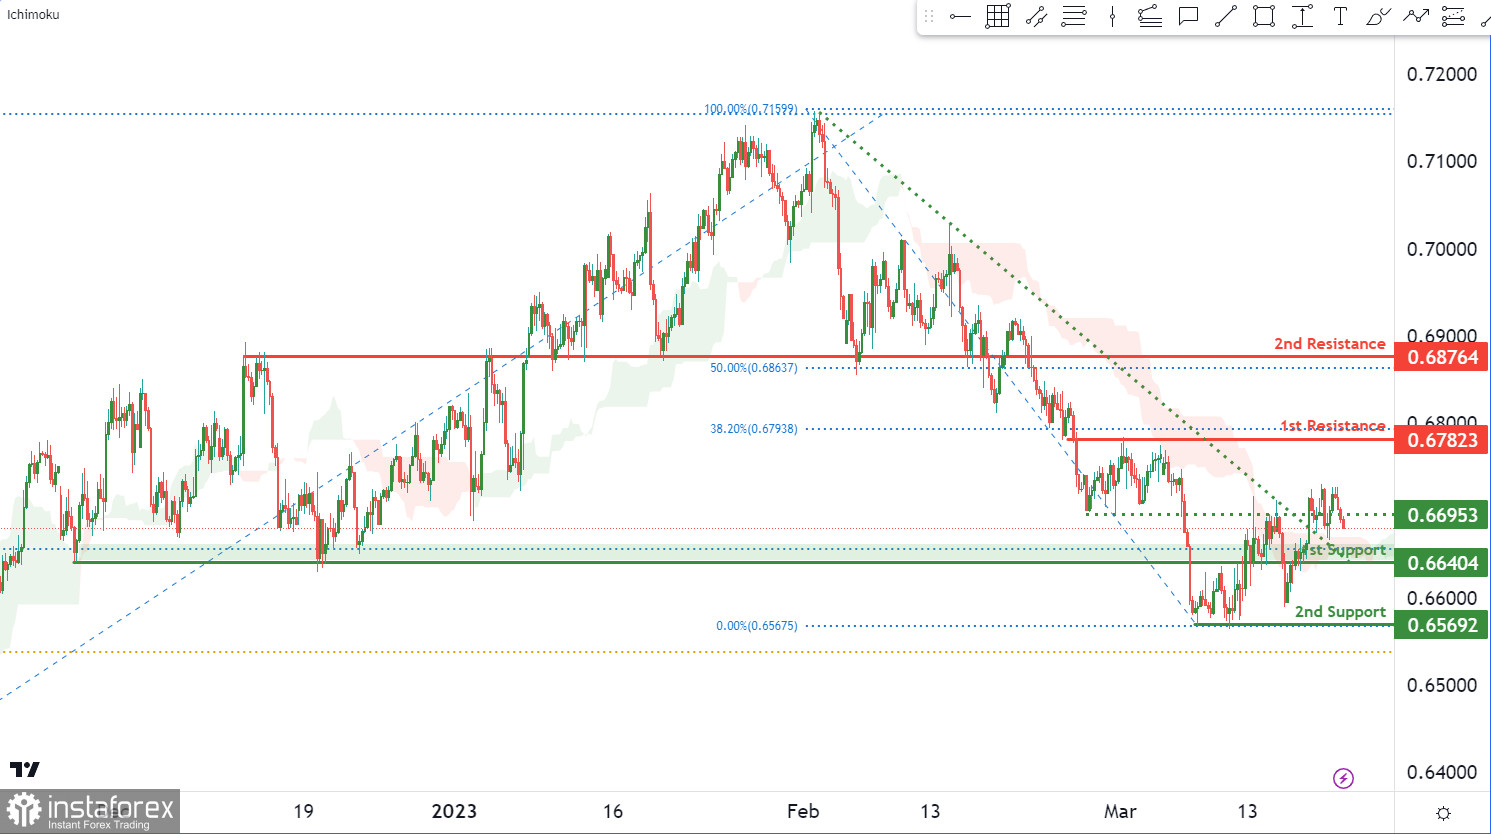
Currently, the AUD/USD chart reflects bullish momentum, indicated by the break above a descending resistance line and the crossing above the Ichimoku cloud. The potential for continued bullish movement towards the first resistance level is evident.
The first support level is located at 0.6640, and it is considered a robust overlap support level. Another support level at 0.6569 is a multi-swing low support level, where the price has previously rebounded several times.
On the other hand, the first resistance level at 0.6782 represents a multi-swing high resistance level, which coincides with the 38.20% Fibonacci retracement level. Breaking above this level could lead to the second resistance level at 0.6876, which is another notable overlap resistance level.
You have already liked this post today
*The market analysis posted here is meant to increase your awareness, but not to give instructions to make a trade.


