See also

 29.03.2023 05:16 PM
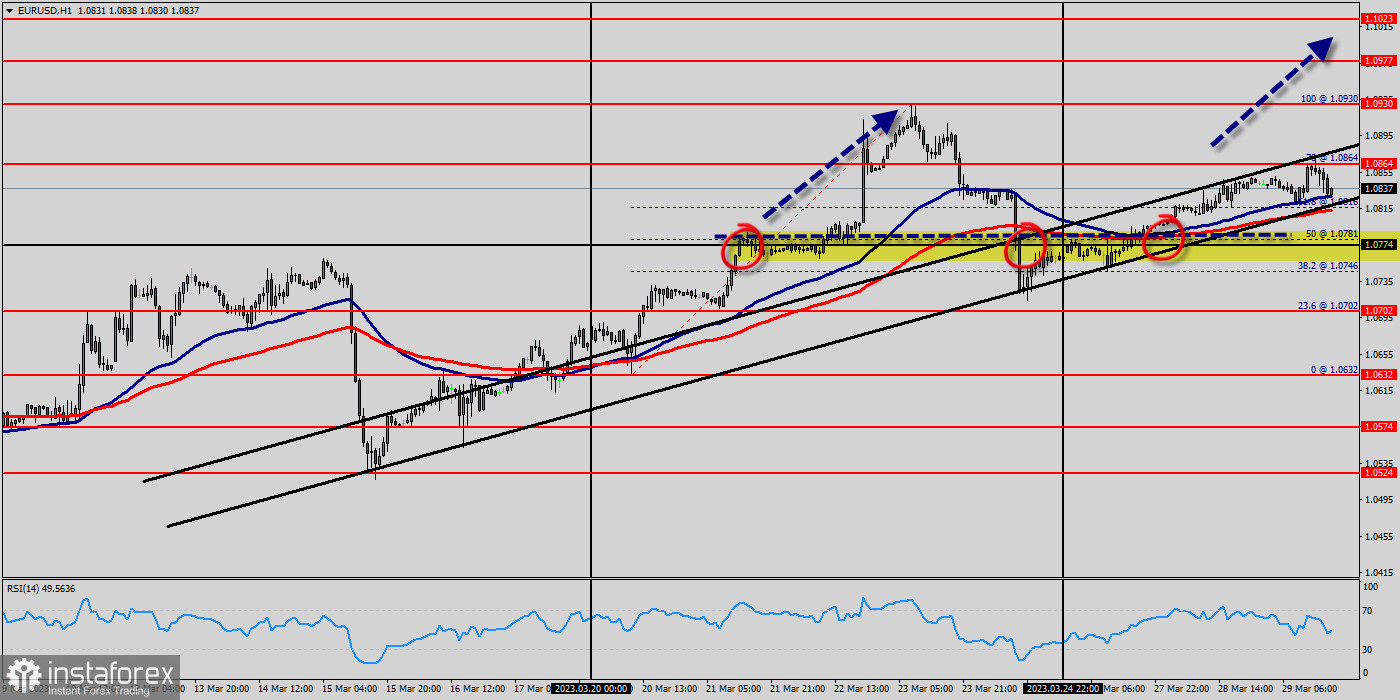
Overview:
As expected, the EUR/USD pair is still moving upwards from the level of 1.0650. Yesterday, the pair rose from the level of 1.0650 (this level of 1.0650 is represented a major support) to the top around 1.0836.
Today, the first resistance level is seen at 1.0737 followed by 1.0800, while daily support 1 is seen at 1.0650. According to the previous events, the EUR/USD pair is still moving between the levels of 1.0650 and 1.0800; for that we expect a range of 150 pips (1.0650 - 1.0800).
If the EUR/USD pair fails to break through the minor support level of 1.0687, the market will rise further to 1.0737. This would suggest a bullish market because the RSI indicator is still in a positive area and does not show any trend-reversal signs.
Moreover, the RSI starts signaling a downward trend, as the trend is still showing strength above the moving average (100) and (50). Thus, the market is indicating a bullish opportunity above the level of 1.0650. The pair is expected to rise lower towards at least 1.0864 with a view to test the daily resistance. Next target at the price of 1.0900.
On the other hand, if the EUR/USD pair fails to break through the resistance level of 1.0737 this week, the market will decline further to 1.0632. The pair is expected to drop lower towards at least 1.0774 with a view to test the weekly pivot point.
Also, it should be noted that the weekly pivot point will act as minor support today. So, if a breakout takes place at the support level of 1.0632 (major support), then this scenario may become invalidated.
You have already liked this post today
*The market analysis posted here is meant to increase your awareness, but not to give instructions to make a trade.


