empty
10.04.2023 06:41 AM
BTCUSD, Daily | Potential reversal from 1st resistance?

This image is no longer relevant

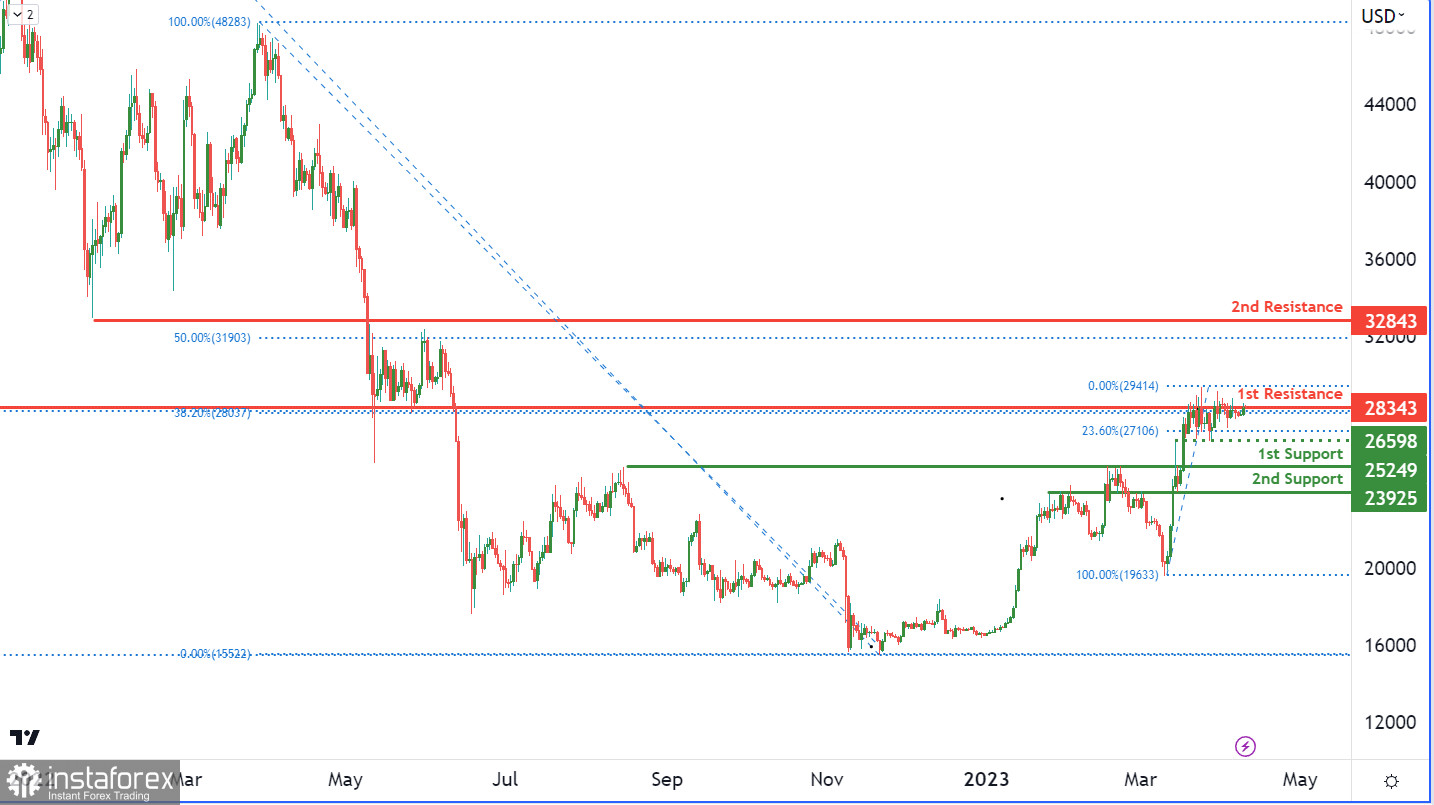
The BTC/USD chart currently reflects a bearish momentum in the cryptocurrency market, and Bitcoin seems to be following the trend. The chart suggests that the price of Bitcoin could face resistance at the 1st resistance level of 28343, which has previously been an important level as an overlap resistance. If Bitcoin fails to break through this level, it may result in a bearish reaction causing the price to drop towards the 1st support level of 25249. This level, being a pullback support, could act as a strong support for the price of Bitcoin.

In the event that the price of Bitcoin breaks through the 1st resistance level, the next resistance level it could face is the 2nd resistance level of 32843, which is a pullback resistance. Conversely, if Bitcoin breaks below the 1st support level, the next support level it could drop to is the 2nd support level of 23925. This level, also being a pullback support, could potentially act as a strong support for the price of Bitcoin.

Additionally, there is an intermediate support level at 26598, which is a swing low support and is accompanied by a 23.60% Fibonacci retracement. This level could potentially provide support to the price of Bitcoin if it drops towards the 1st support level. Overall, the BTC/USD chart's momentum is bearish, indicating that the price is expected to continue falling in the near term.

Dean Leo,
Analytical expert of InstaTrade
© 2007-2025

Recommended Stories

EUR/USD Forecast for July 4, 2025

The main event of yesterday largely aligned with our forecasts — specifically, the anticipated "number play" occurred. But it was done very delicately, just enough to halt the growth

Laurie Bailey 06:01 2025-07-04 UTC+2

GBP/USD Forecast for July 4, 2025

On the daily chart, the British pound has consolidated below the MACD line. It had an excellent opportunity to also consolidate below the support level of 1.3635, but that attempt

Laurie Bailey 05:58 2025-07-04 UTC+2

Natural Gas Forecast for July 4, 2025

Natural Gas (NG) The daily balance indicator line decisively halted yesterday's price surge — Thursday ended with a decline of 2.63%. The drop, in turn, was held back

Laurie Bailey 05:53 2025-07-04 UTC+2

EUR/USD. July 3rd. The Most Important Day of the Week

On Wednesday, the EUR/USD pair rebounded from the 1.1802 level, reversed in favor of the U.S. dollar, and showed a slight decline. However, by Thursday morning, the pair had returned

Samir Klishi 12:10 2025-07-03 UTC+2

GBP/USD. The Sterling May Stop Receiving Support

As previously mentioned on multiple occasions, the strength of the major currencies traded against the U.S. dollar on the foreign exchange (Forex) market was based solely on the fundamental weakness

Pati Gani 11:27 2025-07-03 UTC+2

Forex forecast 03/07/2025: EUR/USD, USD/JPY, GBP/USD, SP500, Gold and Bitcoin

Useful links: My other articles are available in this section InstaForex course for beginners Popular Analytics Open trading account Important: The begginers in forex trading need to be very careful

Sebastian Seliga 10:57 2025-07-03 UTC+2

Forecast for GBP/USD on July 3, 2025

On the hourly chart, the GBP/USD pair on Wednesday rebounded from the 200.0% retracement level at 1.3749, reversed in favor of the U.S. dollar, and fell below the support zone

Samir Klishi 10:03 2025-07-03 UTC+2

If Crude Oil manages to break below the Pivot level, it has the potential to test its nearest Support level, Thursday, July 03, 2025.

Crude Oil, Thursday, July 03, 2025. Poor global economic conditions such as the stagnation of Chinese & European manufacturing have triggered concerns about global Crude Oil demand and expectations

Arief Makmur 07:36 2025-07-03 UTC+2

The Nasdaq 100 index has the potential to test its closest Resistance level, Thursday, July 03, 2025.

Nasdaq 100 Index, Thursday, July 03, 2025. Positive Big Tech Company financial reports and the increasingly strong rumors of the Fed's Dovish policy and the rise of AI innovation have

Arief Makmur 07:36 2025-07-03 UTC+2

EUR/AUD Forecast for July 3, 2025

On the daily chart, the EUR/AUD pair is moving sideways in the upper half of the price channel and above the MACD indicator line. The signal line of the Marlin

Laurie Bailey 06:33 2025-07-03 UTC+2
Can't speak right now?
Ask your question in the chat.
 

Dear visitor,

Your IP address shows that you are currently located in the USA. If you are a resident of the United States, you are prohibited from using the services of InstaFintech Group including online trading, online transfers, deposit/withdrawal of funds, etc.

If you think you are seeing this message by mistake and your location is not the US, kindly proceed to the website. Otherwise, you must leave the website in order to comply with government restrictions.

Why does your IP address show your location as the USA?

  • - you are using a VPN provided by a hosting company based in the United States;
  • - your IP does not have proper WHOIS records;
  • - an error occurred in the WHOIS geolocation database.

Please confirm whether you are a US resident or not by clicking the relevant button below. If you choose the wrong option, being a US resident, you will not be able to open an account with InstaTrade anyway.

We are sorry for any inconvenience caused by this message.