empty
27.04.2023 11:29 PM
Technical analysis of EUR/USD for April 27, 2023

This image is no longer relevant

Overview :

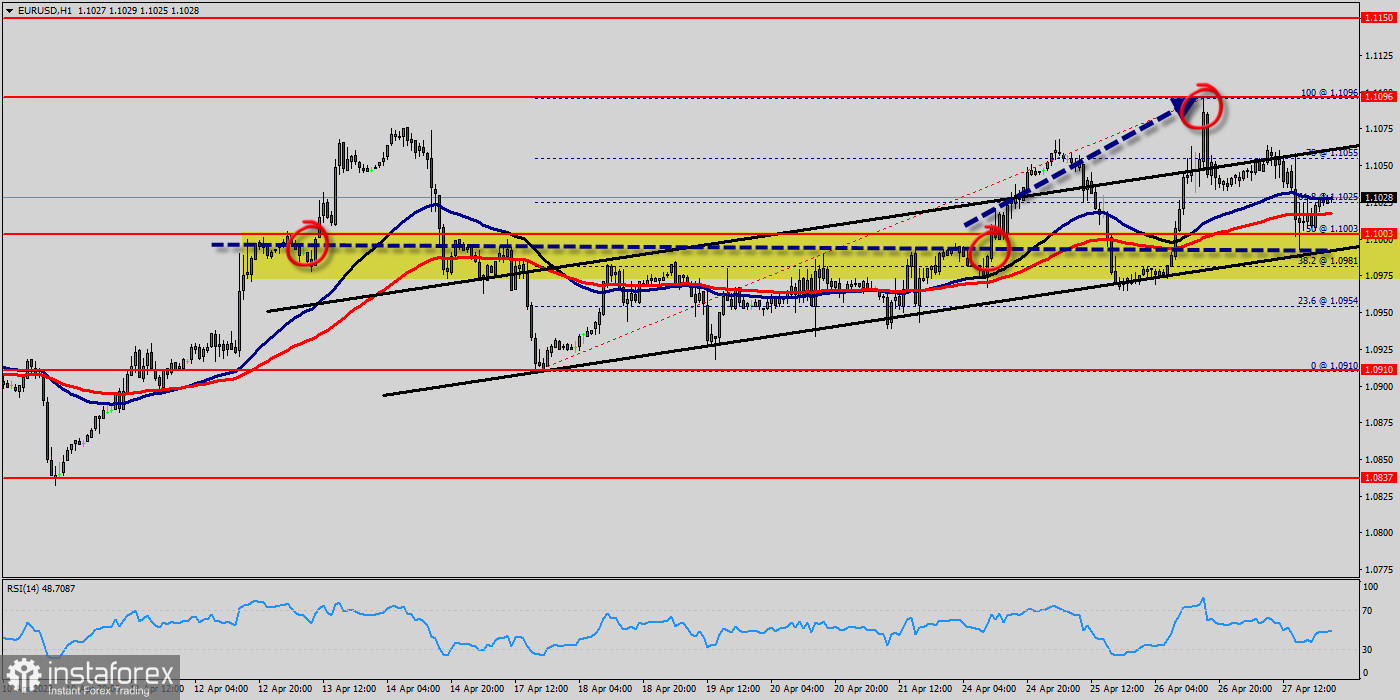
The EUR/USD pair continues to move upwards from the level of 1.1003. Today, the first support level is currently seen at 1.0910, the price is moving in a bullish channel now. Furthermore, the price has been set above the strong support at the level of 1.0910, which coincides with the 0% Fibonacci retracement level - double bottom - last bearish wave.

This support has been rejected three times confirming the veracity of an uptrend.

According to the previous events, we expect the EUR/USD pair to trade between 1.0910 and 1.0954.

Yesterday, the pair rose from the level of 1.0910 to 1.1003 which coincides with a ratio of 50% Fibonacci on the daily chart. Today, resistance is seen at the levels of 1.1096 and 1.1150.

We expect the price to set above the strong support at the levels of 1.0910 and 1.1003; because the price is in a bearish channel now. The RSI starts signaling an upward trend. Consequently, the market is likely to show signs of a bullish trend.

So, the support stands at 1.0910, while daily resistance is found at 1.1096. Therefore, the market is likely to show signs of a bullish trend around the spot of 1.1003.

In other words, buy orders are recommended above the spot of 1.1003 with the first target at the level of 1.1096; and continue towards 1.1150.

However, if the EUR/USD pair fails to break through the resistance level of 1.1096 today, the market will decline further to 1.0910.

Weekly range between the levels of 1.0910 - 1.1150.

It should be noted that volatility is very high for that the EUR/USD pair is still moving between 1.0910 and 1.1150 in coming hours.

Recommended Stories

EUR/USD. June 12. A Setback for the Dollar

Good day, dear traders! On Wednesday, the EUR/USD pair continued its upward movement after rebounding from the support zone of 1.1374–1.1380. It successfully consolidated above the 76.4% Fibonacci retracement level

Samir Klishi 10:15 2025-06-12 UTC+2

GBP/USD. June 12. British Economy Falters

Good day, dear traders! On the hourly chart, on Wednesday, the GBP/USD pair reversed in favor of the British pound and consolidated above the 161.8% Fibonacci retracement level at 1.3520

Samir Klishi 10:15 2025-06-12 UTC+2

Technical Analysis of Daily Price Movement Crude Oil Commodity Instrument, Thursday June 12, 2025.

If we look at the daily chart of the Crude Oil commodity instrument, there appears to be a Divergence between the price movement of #CL and the Stochastic Oscillator indicator

Arief Makmur 08:10 2025-06-12 UTC+2

Technical Analysis of Intraday Price Movement of Nasdaq 100 Index, Thursday June 12, 2025.

On the 4-hour chart of the Nasdaq 100 index, there is a divergence between its price movement and the Stochastic Oscillator indicator, especially with the current confirmation of the price

Arief Makmur 08:10 2025-06-12 UTC+2

Trading Signals for EUR/USD for June 12-19, 2025: sell below 1.1500 (21 SMA - 8/8 Murray)

If the euro price falls below 1.1500 in the coming hours, this could be seen as an opportunity to sell. Technically, it appears overbought on the H4 chart and could

Dimitrios Zappas 05:33 2025-06-12 UTC+2

Trading Signals for GOLD (XAU/USD) for June 12-19, 2025: sell below $3,386 (21 SMA - 7/8 Murray)

The XAU/USD trend remains bullish as long as the price consolidates above 3,331. Therefore, it would be prudent to buy gold as long as the price consolidates above 3,359, where

Dimitrios Zappas 05:32 2025-06-12 UTC+2

EUR/USD Forecast for June 12, 2025

The U.S. inflation data released on Wednesday stirred the markets: the dollar index dropped by 0.47%, WTI oil surged by 5.54%, gold rose by 1.27%, and 5-year U.S. Treasury yields

Laurie Bailey 04:40 2025-06-12 UTC+2

GBP/USD Forecast for June 12, 2025

On Wednesday, the British pound successfully avoided a decline below technical support levels, reversing upward from them. The price rebounded from the MACD indicator line on the daily chart, while

Laurie Bailey 04:40 2025-06-12 UTC+2

USD/JPY Forecast for June 12, 2025

The price correction since May 27 was complex and prolonged, posing a risk of a breakout above 146.11. However, this risk is no longer a concern with the reversal from

Laurie Bailey 04:40 2025-06-12 UTC+2

Bitcoin: Dollar Strength Could Trigger a Downturn in the Crypto Market

Today, the market's main focus will be the release of the U.S. inflation report, which is expected to show not only a halt in the recent decline but the highest

Pati Gani 11:47 2025-06-11 UTC+2
Can't speak right now?
Ask your question in the chat.
 

Dear visitor,

Your IP address shows that you are currently located in the USA. If you are a resident of the United States, you are prohibited from using the services of InstaFintech Group including online trading, online transfers, deposit/withdrawal of funds, etc.

If you think you are seeing this message by mistake and your location is not the US, kindly proceed to the website. Otherwise, you must leave the website in order to comply with government restrictions.

Why does your IP address show your location as the USA?

  • - you are using a VPN provided by a hosting company based in the United States;
  • - your IP does not have proper WHOIS records;
  • - an error occurred in the WHOIS geolocation database.

Please confirm whether you are a US resident or not by clicking the relevant button below. If you choose the wrong option, being a US resident, you will not be able to open an account with InstaTrade anyway.

We are sorry for any inconvenience caused by this message.