See also
The price of gold dropped a little today after reaching 2,067 new high. After its amazing rally, a temporary drop was natural. The rate came back to test and retest the near-term support levels before jumping higher again. It's located at 2,042 at the time of writing.
Lanter, the ECB and the US data should bring more action on this market. The Main Refinancing Rate is expected at 3.75%, but the Monetary Policy Statement and the ECB Press Conference should shake the price. In addition, the US is to release the Unemployment Claims and Trade Balance data.
Tomorrow, the NFP, Average Hourly Earnings, and Unemployment Rate data should move the price.
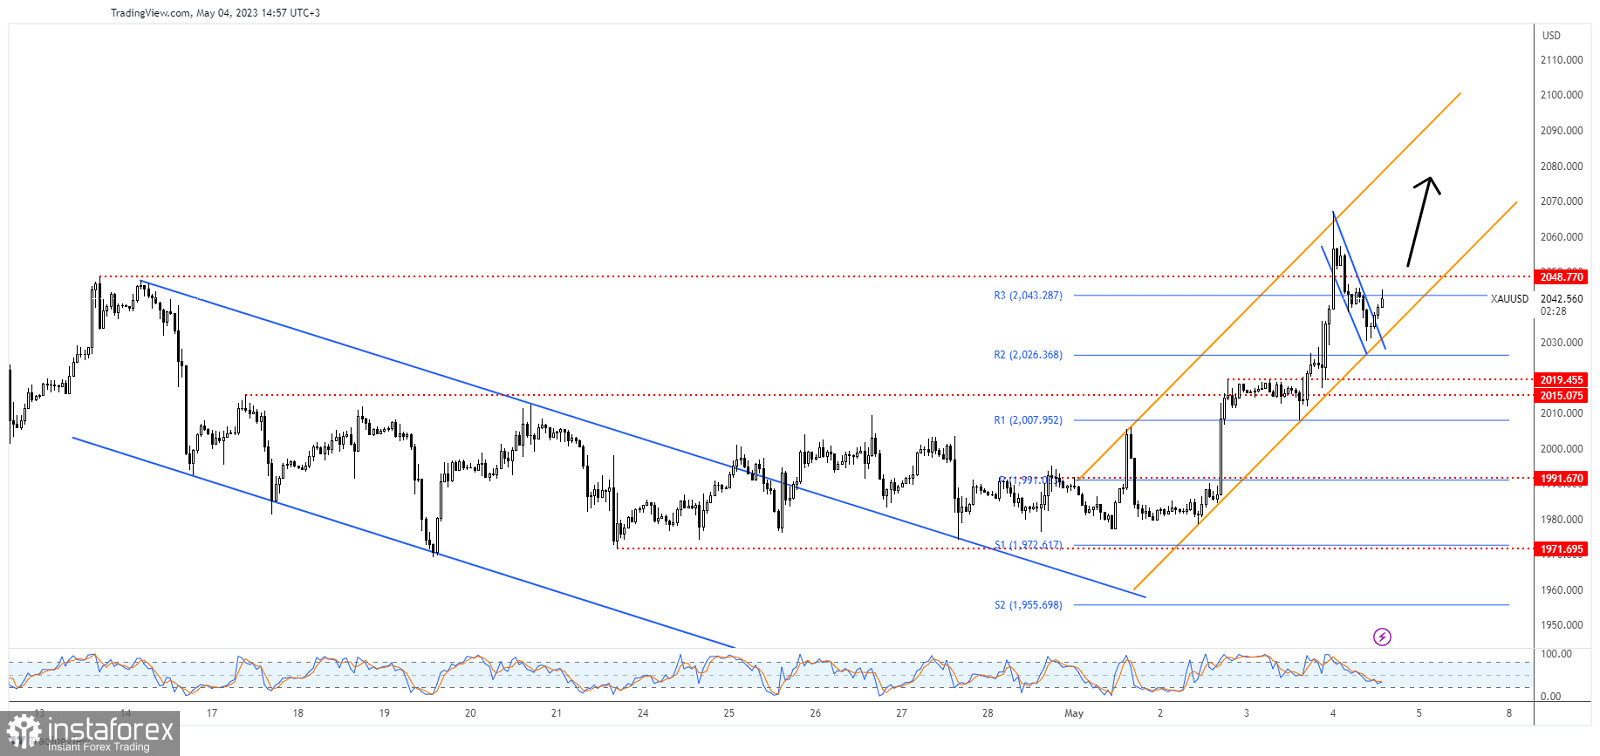
As you can see on the H1 chart, the rate failed to stay above the broken resistance of 2,048 signaling a correction. It has developed a flag pattern inside the ascending channel. The rate escaped from that minor down channel signaling that the retreat ended.
The bias is bullish as long as it stays within the ascending channel's body, above the uptrend line. Now, it challenges the weekly R3 (2,043) static resistance.
Staying above the uptrend line and closing again above 2,048 validates further growth. This suggests a buying opportunity. The former high of 2,067, 2,070 historical level, and the channel upside line represent upside targets if Gold continues to grow.
You have already liked this post today
*The market analysis posted here is meant to increase your awareness, but not to give instructions to make a trade.
The test of the 146.75 level coincided with the moment when the MACD indicator had just started to move upward from the zero line, confirming a valid entry point
The test of the 1.3529 level occurred when the MACD indicator had just started to move down from the zero line, confirming a valid entry point for selling the pound
The test of the 1.1757 level occurred at the moment when the MACD indicator had just started to rise from the zero line, confirming a valid entry point for buying
Trade Analysis and Euro Trading Tips The test of the 1.1756 level coincided with the MACD indicator moving well below the zero line, which limited the pair's downward potential. Eurozone
The test of the 146.56 level occurred when the MACD indicator had already moved significantly above the zero line, which limited the pair's upward potential—especially in the context
The test of the 1.3551 level occurred when the MACD indicator had just started moving up from the zero line, confirming the validity of the entry point for a long
InstaTrade video
analytics
Daily analytical reviews
Your IP address shows that you are currently located in the USA. If you are a resident of the United States, you are prohibited from using the services of InstaFintech Group including online trading, online transfers, deposit/withdrawal of funds, etc.
If you think you are seeing this message by mistake and your location is not the US, kindly proceed to the website. Otherwise, you must leave the website in order to comply with government restrictions.
Why does your IP address show your location as the USA?
Please confirm whether you are a US resident or not by clicking the relevant button below. If you choose the wrong option, being a US resident, you will not be able to open an account with InstaTrade anyway.
We are sorry for any inconvenience caused by this message.