See also
The price of gold crashed after retesting the near-term resistance levels. It's trading at 1,906 at the time of writing far below 1,930 yesterday's high. After its massive drop, we cannot exclude a temporary rebound as the rate could test and retest the near-term resistance levels before resuming its drop.
A sell-off was natural after the US CB Consumer Confidence came in better than expected and after Canadian CPI and Core CPI reported lower inflation. Today, the Australian CPI reported a lower inflation as well, while the US Goods Trade Balance came in better than expected. Tomorrow, the US Final GDP, Unemployment Claims, and Fed Chair Powell Speaks should move the price.
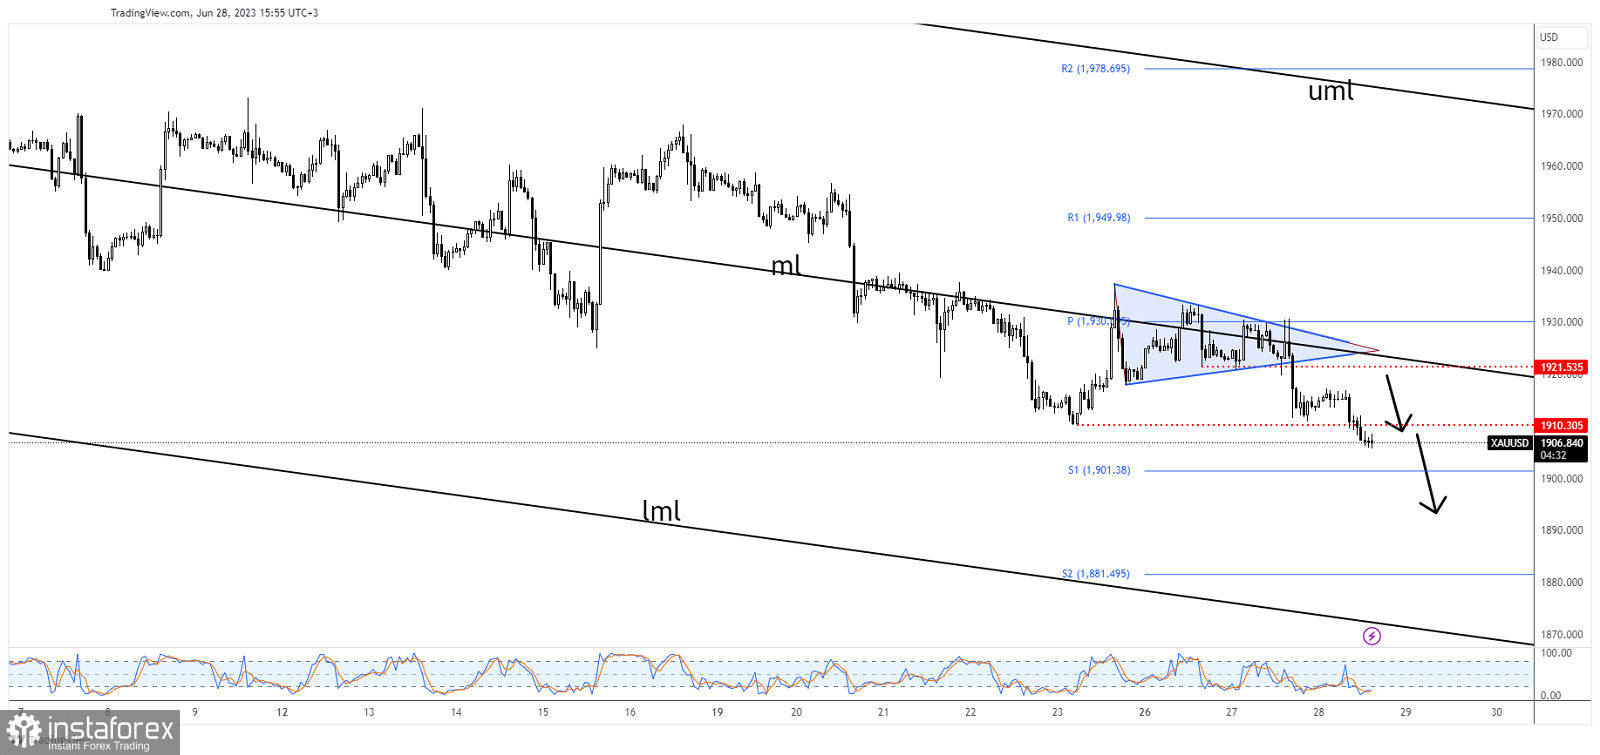
As you can see on the H1 chart, XAU/SUD registered only false breakouts above the weekly pivot point of 1,930 and through the triangle announcing a new sell-off. I told you yesterday that escaping from the triangle pattern should bring us new opportunities.
Its failure to stay above the median line (ml) of the descending pitchfork confirmed strong selling pressure. Now, it has dropped below the 1,910 former low signaling more declines.
Validating the breakdown below 1,910 activates a larger drop. A bearish closure below the S1 (1,901) opens the door for more declines and is seen as a new selling signal. The S2 (1,881) and the lower median line (lml) represent a potential target.
You have already liked this post today
*The market analysis posted here is meant to increase your awareness, but not to give instructions to make a trade.
In my morning forecast, I highlighted the 1.3531 level and planned to make trading decisions based on it. Let's look at the 5-minute chart and analyze what happened. A decline
In my morning forecast, I highlighted the 1.1556 level and planned to base market entry decisions on it. Let's look at the 5-minute chart and analyze what happened. A rise
Analysis of Thursday's Trades 1H Chart of GBP/USD On Thursday, the GBP/USD pair demonstrated a relatively strong upward movement, though the British pound did experience intraday declines. There were many
Analysis of Thursday's Trades 1H Chart of EUR/USD The EUR/USD currency pair on Thursday and during the night into Friday exhibited "American-style racing." Over the past two days, the U.S
On Thursday, the GBP/USD currency pair continued to move upward. However, somewhat surprisingly, the pound appreciated less this week than the euro. The British currency came under pressure first from
The EUR/USD currency pair continued its strong upward movement on Thursday, which began on Wednesday. A downward pullback started by the end of the day, but it was significantly weaker
Analysis of Wednesday's Trades 1H Chart of GBP/USD On Wednesday, the GBP/USD pair moved in a manner similar to the EUR/USD pair. The U.S. inflation report became a new driver
Analysis of Wednesday's Trades 1H Chart of EUR/USD On Wednesday, the EUR/USD currency pair resumed its upward trend, lasting more than four months. More precisely, it has continued since Donald
On Wednesday, the GBP/USD currency pair resumed its upward movement. As previously noted, the British currency currently has no valid reason to decline against the U.S. dollar—specifically, against the U.S
Your IP address shows that you are currently located in the USA. If you are a resident of the United States, you are prohibited from using the services of InstaFintech Group including online trading, online transfers, deposit/withdrawal of funds, etc.
If you think you are seeing this message by mistake and your location is not the US, kindly proceed to the website. Otherwise, you must leave the website in order to comply with government restrictions.
Why does your IP address show your location as the USA?
Please confirm whether you are a US resident or not by clicking the relevant button below. If you choose the wrong option, being a US resident, you will not be able to open an account with InstaTrade anyway.
We are sorry for any inconvenience caused by this message.