See also

 23.01.2023 09:48 AM
Trend analysis (Fig. 1).
The pound-dollar pair may move upward from the level of 1.2394 (closing of Friday's daily candle) to the upper fractal at 1.2442 (red dotted line). Upon reaching this level, a downward movement is possible to 1.2347, the 14.6% retracement level (blue dotted line). When testing this level, the price may move upward to the upper fractal at 1.2442 (red dotted line).
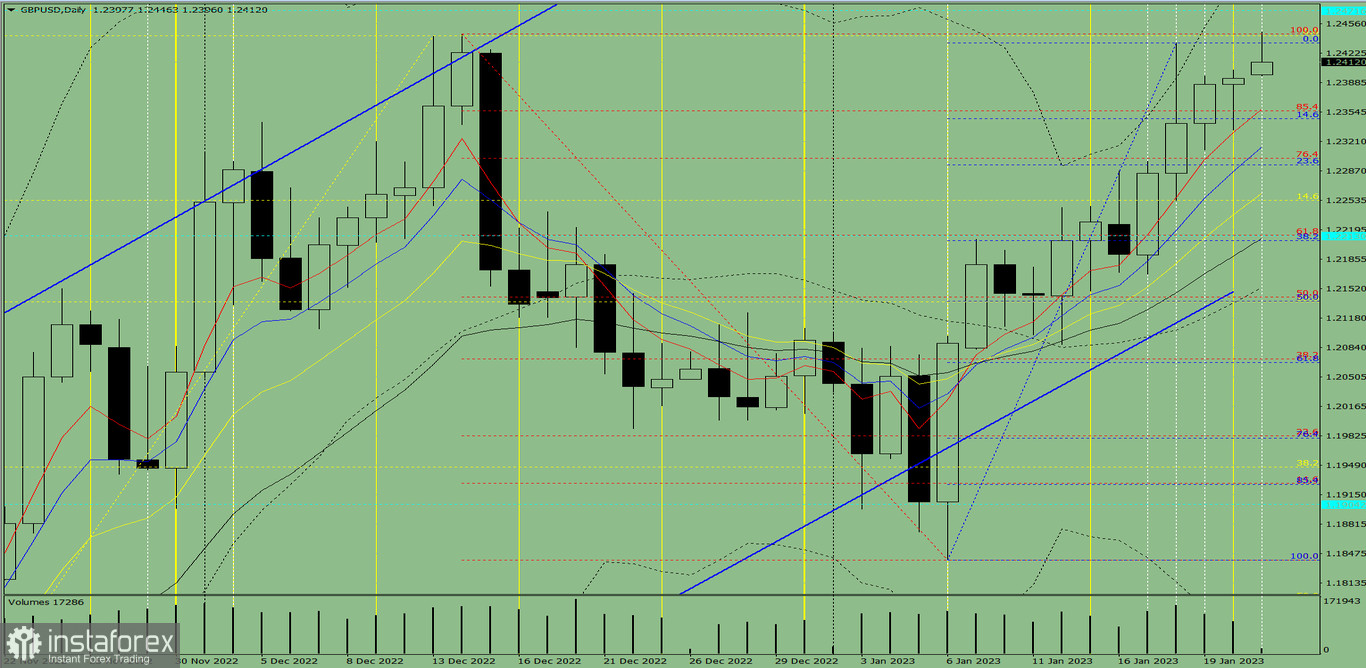
Fig. 1 (daily chart).
Comprehensive analysis:
General conclusion:
Today, the price may move upward from the level of 1.2394 (closing of Friday's daily candle) to the upper fractal at 1.2442 (red dotted line). Upon reaching this level, a downward movement is possible to 1.2347, the 14.6% retracement level (blue dotted line). When testing this level, the price may move upward to the upper fractal at 1.2442 (red dotted line).
Alternatively, the price may move upward from the level of 1.2394 (closing of Friday's daily candle) to the upper fractal at 1.2442 (red dotted line). Upon reaching this level, a downward movement is possible to 1.2294, the 23.6% retracement level (blue dotted line). When testing this level, the price may move upward to the upper fractal at 1.2442 (blue dotted line).
You have already liked this post today
*The market analysis posted here is meant to increase your awareness, but not to give instructions to make a trade.


