empty
12.09.2023 11:49 AM
Technical Analysis of GBP/USD for September 12, 2023

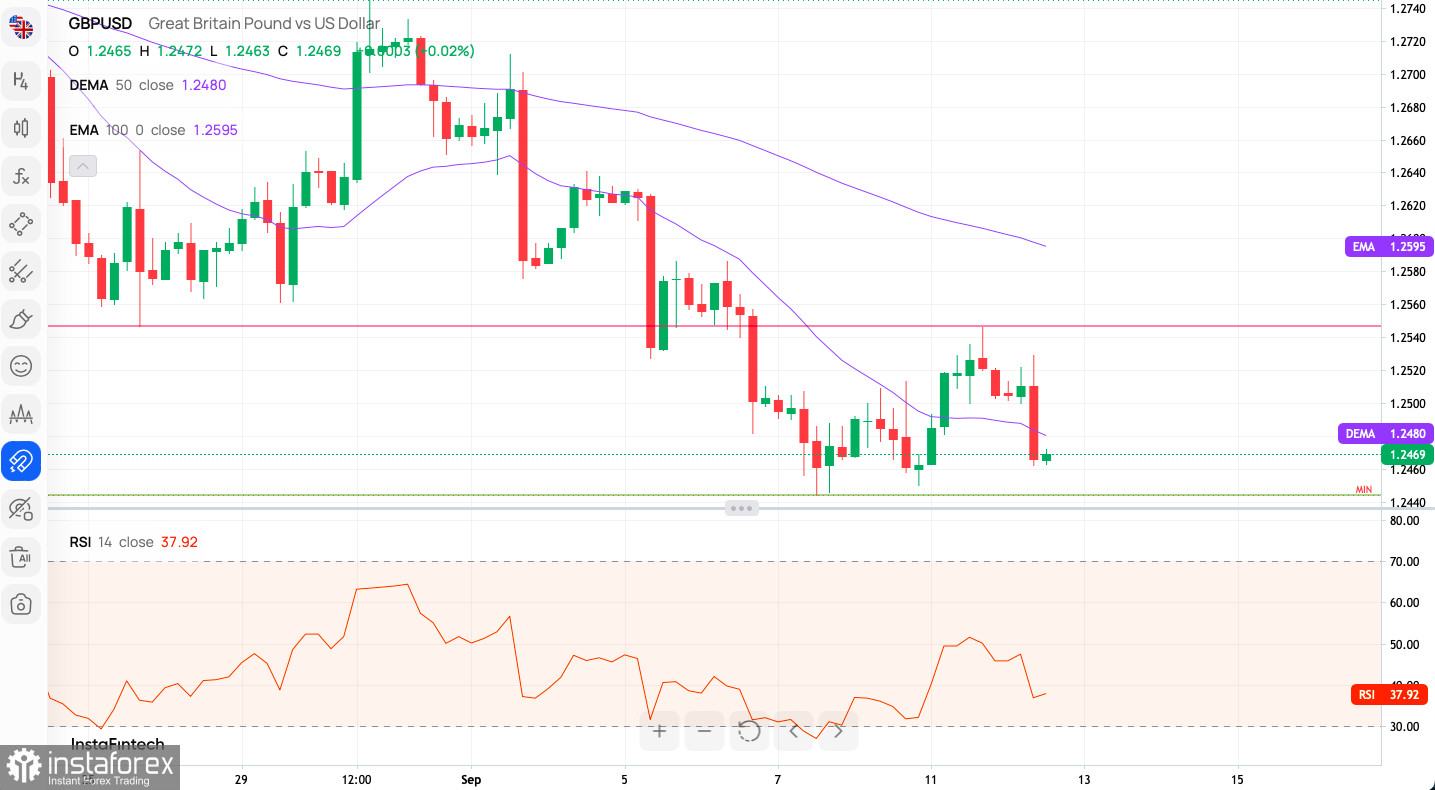
Technical Market Outlook:

The GBP/USD pair has been moving lower on the H4 time frame chart after the bulls got rejected from the level of 1.2546 during the bounce attempt. The market still trades below the short-term trend line resistance, so any violation of the short-term support seen at the level of 1.2444 will extend the drop lower towards the level of 1.2393 and 1.2377. The intraday technical resistance is seen at the level of 1.2546 and the intraday technical support is seen at the level of 1.2450. The weak and negative momentum on the H4 time frame chart support the short-term bearish outlook for GBP, however, now is the time for bull to bounce higher and test the technical resistance.

This image is no longer relevant

Weekly Pivot Points:

WR3 - 1.26098

WR2 - 1.25569

WR1 - 1.25339

Weekly Pivot - 1.25040

WS1 - 1.24810

WS2 - 1.24511

WS3 - 1.23982

Trading Outlook:

The bulls were rejected at the key technical resistance located at the level of 1.3163 and a breakout above this level is needed to extend the up trend towards the last Weekly swing high seen at 1.4248. The weekly time frame chart shows the Bearish Engulfing candlestick pattern was made during the breakout attempt above the 1.3163, so now the bears are in charge of the market. Any sustained breakout below the technical support seen at the level of 1.1775 would dramatically increase the chances of another leg down towards the level of 1.1494.

Recommended Stories

USD/JPY. Analysis and Forecast

The USD/JPY pair remains in a consolidation phase near a three-week high, supported by U.S. dollar strength and mixed market signals. The dollar is being bolstered by U.S. President Donald

Irina Yanina 12:17 2025-07-14 UTC+2

Technical Analysis for the Week of July 14–19: GBP/USD Currency Pair

Last week, the pair moved downward and broke below the 8-period EMA at 1.3509 (thin blue line), closing the weekly candle at 1.3487. In the upcoming week, the price

Stefan Doll 11:40 2025-07-14 UTC+2

Technical Analysis for the Week of July 14–19: EUR/USD Currency Pair

Last week, the pair moved downward and nearly tested the 23.6% retracement level at 1.1647 (blue dashed line), after which the price turned upward and closed the weekly candle

Stefan Doll 11:34 2025-07-14 UTC+2

Forecast for EUR/USD on July 14, 2025

On Friday, the EUR/USD pair rebounded from the 127.2% Fibonacci retracement level at 1.1712, reversed in favor of the U.S. dollar, and resumed its decline toward the 1.1645 level

Samir Klishi 11:31 2025-07-14 UTC+2

Forecast for GBP/USD on July 14, 2025

On the hourly chart, the GBP/USD pair on Friday consolidated below the 127.2% Fibonacci level at 1.3527 and continued its decline toward the next retracement level of 100.0% at 1.3444

Samir Klishi 11:25 2025-07-14 UTC+2

Cable still has the potential to continue its decline to its support level on Monday, July 14, 2025.

GBP/USD – Monday, July 14, 2025 GBP/USD is moving in a weakening condition where this is confirmed by its price movement below the 50-EMA, which is also below the 200-EMA

Arief Makmur 07:21 2025-07-14 UTC+2

The USD/CAD commodity currency pair has the potential to correct towards its pivot point today, Monday, July 14, 2025.

USD/CAD, July 14, 2025 Although the Lonnie is moving in a neutral-bullish position, there is potential for the USD/CAD commodity currency pair to test its pivot and support levels today

Arief Makmur 07:21 2025-07-14 UTC+2

EUR/USD Forecast for July 14, 2025

Friday's candlestick for the EUR/USD pair closed bearish, with the price consolidating below the daily MACD line. The objective for today is to secure a close below the 1.1692 level

Laurie Bailey 05:31 2025-07-14 UTC+2

GBP/USD Forecast for July 14, 2025

On Friday, the British pound lost more than 80 pips, breaking below the daily balance line and the key signal level at 1.3510. The decline was driven by weak

Laurie Bailey 05:31 2025-07-14 UTC+2

AUD/USD Forecast for July 14, 2025

On the daily chart, the AUD/USD pair is positioned between the MACD line (0.6551) and the upper boundary of the local price channel (blue, 0.6597). A breakout of either level

Laurie Bailey 05:31 2025-07-14 UTC+2
Can't speak right now?
Ask your question in the chat.
 

Dear visitor,

Your IP address shows that you are currently located in the USA. If you are a resident of the United States, you are prohibited from using the services of InstaFintech Group including online trading, online transfers, deposit/withdrawal of funds, etc.

If you think you are seeing this message by mistake and your location is not the US, kindly proceed to the website. Otherwise, you must leave the website in order to comply with government restrictions.

Why does your IP address show your location as the USA?

  • - you are using a VPN provided by a hosting company based in the United States;
  • - your IP does not have proper WHOIS records;
  • - an error occurred in the WHOIS geolocation database.

Please confirm whether you are a US resident or not by clicking the relevant button below. If you choose the wrong option, being a US resident, you will not be able to open an account with InstaTrade anyway.

We are sorry for any inconvenience caused by this message.