See also

 06.10.2023 05:50 AM
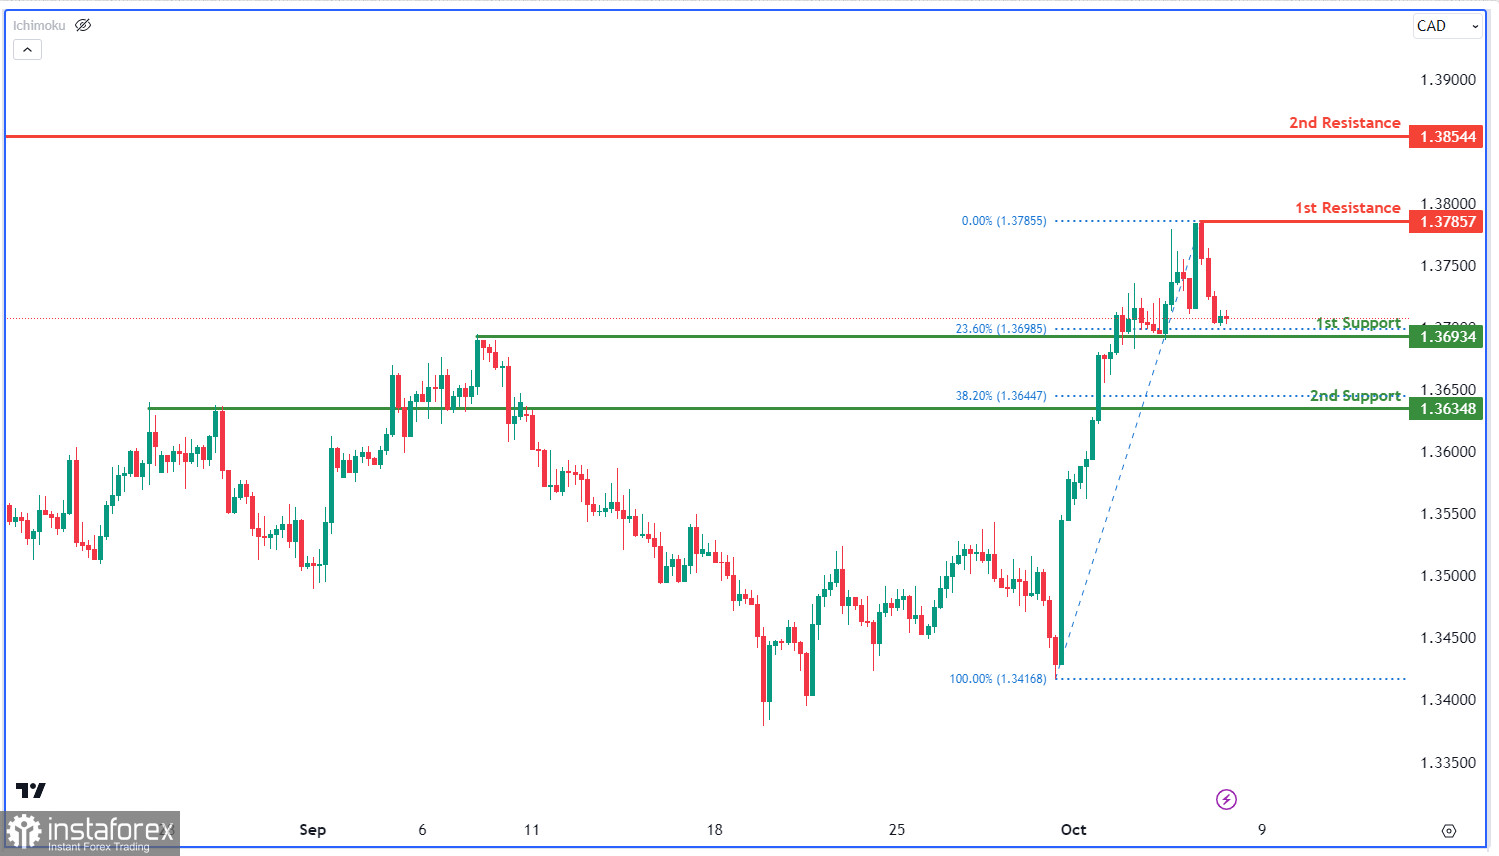
USD/CAD chart shows bearish momentum, potential drop to 1st support (1.3693, overlap support, 23.60% Fibonacci retracement) or 2nd support (1.3634, overlap support, 38.20% Fibonacci retracement). 1st resistance (1.3806) and 2nd resistance (1.3854) act as pullback resistances.
You have already liked this post today
*The market analysis posted here is meant to increase your awareness, but not to give instructions to make a trade.


