empty
30.10.2023 10:35 AM
EUR/JPY: more declines activated

The EUR/JPY extended its sell-off and now is located at 157.74 at the time of writing. The downside pressure is high, so more declines are favored. You knew from my previous analysis that the price action announced a potential larger drop.

Fundamentally, the Spanish Flash CPI reported only a 3.5% growth versus the 3.8% growth estimated. Furthermore, the German Prelim CPI and German Prelim GDP should be released as well and could bring high action. Tomorrow, the BOJ and the Japanese economic figures could really shake the price. Also, the Eurozone CPI Flash Estimate and Core CPI Flash Estimate should have an impact.

EUR/USD Massive Sell-Off!

This image is no longer relevant

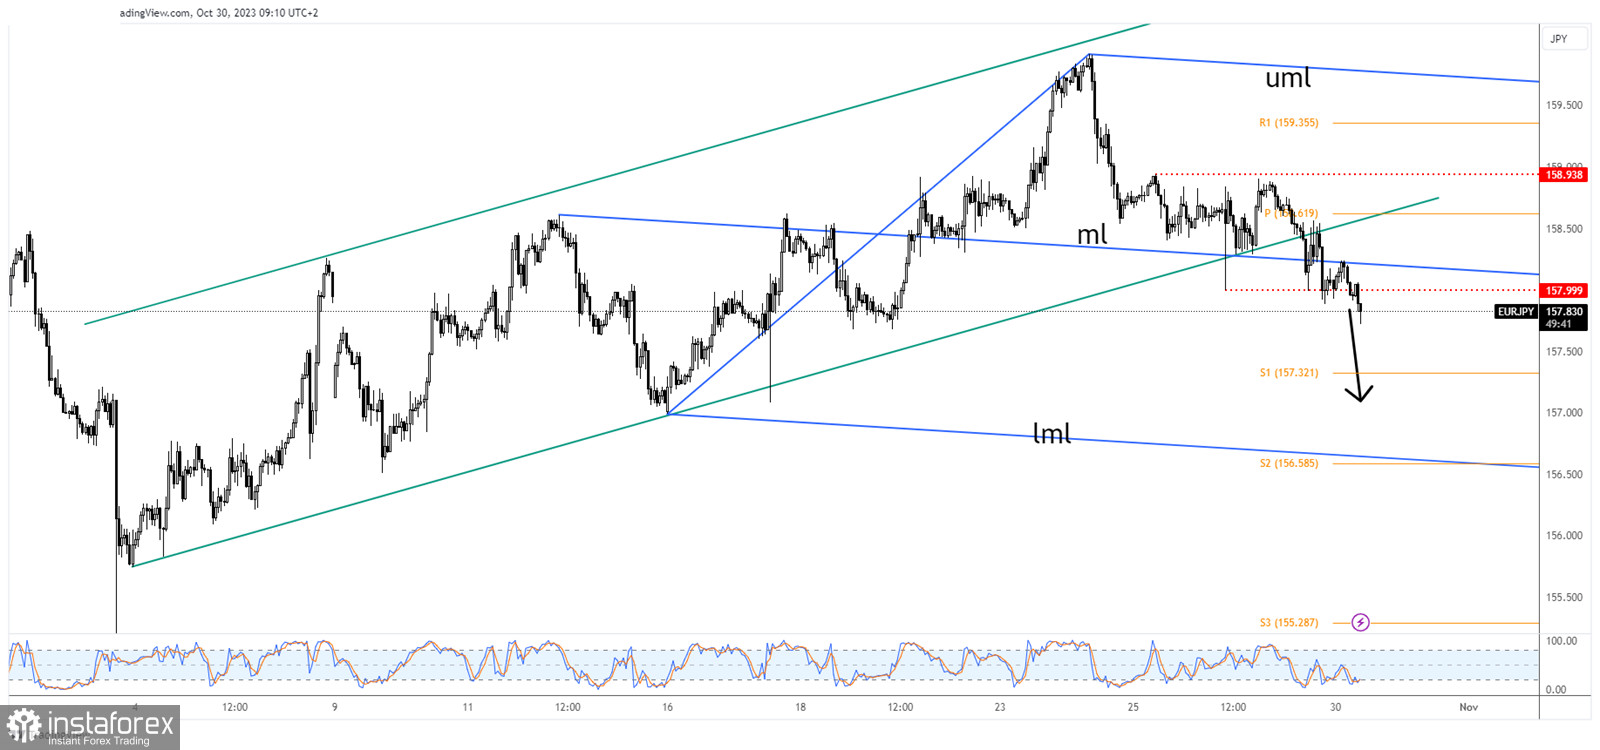
From the technical point of view, EUR/JPY dropped deeper after retesting the broken uptrend line. I've talked about this scenario in my previous analysis.

As you can see on the H1 chart, the rate retested the median line (ml) of the descending pitchfork as well before extending its downward movement.

EUR/JPY Forecast!

You knew from my previous analysis that dropping below 157.99 activates more decline and represents a selling signal. A bearish closure below 157.69 confirms more declines towards the S1 (157.32).

Ralph Shedler,
Analytical expert of InstaTrade
© 2007-2025

Recommended Stories

Technical Analysis of Daily Price Movement Crude Oil Commodity Instrument, Thursday June 12, 2025.

If we look at the daily chart of the Crude Oil commodity instrument, there appears to be a Divergence between the price movement of #CL and the Stochastic Oscillator indicator

Arief Makmur 08:10 2025-06-12 UTC+2

Technical Analysis of Intraday Price Movement of Nasdaq 100 Index, Thursday June 12, 2025.

On the 4-hour chart of the Nasdaq 100 index, there is a divergence between its price movement and the Stochastic Oscillator indicator, especially with the current confirmation of the price

Arief Makmur 08:10 2025-06-12 UTC+2

Trading Signals for EUR/USD for June 12-19, 2025: sell below 1.1500 (21 SMA - 8/8 Murray)

If the euro price falls below 1.1500 in the coming hours, this could be seen as an opportunity to sell. Technically, it appears overbought on the H4 chart and could

Dimitrios Zappas 05:33 2025-06-12 UTC+2

Trading Signals for GOLD (XAU/USD) for June 12-19, 2025: sell below $3,386 (21 SMA - 7/8 Murray)

The XAU/USD trend remains bullish as long as the price consolidates above 3,331. Therefore, it would be prudent to buy gold as long as the price consolidates above 3,359, where

Dimitrios Zappas 05:32 2025-06-12 UTC+2

EUR/USD Forecast for June 12, 2025

The U.S. inflation data released on Wednesday stirred the markets: the dollar index dropped by 0.47%, WTI oil surged by 5.54%, gold rose by 1.27%, and 5-year U.S. Treasury yields

Laurie Bailey 04:40 2025-06-12 UTC+2

GBP/USD Forecast for June 12, 2025

On Wednesday, the British pound successfully avoided a decline below technical support levels, reversing upward from them. The price rebounded from the MACD indicator line on the daily chart, while

Laurie Bailey 04:40 2025-06-12 UTC+2

USD/JPY Forecast for June 12, 2025

The price correction since May 27 was complex and prolonged, posing a risk of a breakout above 146.11. However, this risk is no longer a concern with the reversal from

Laurie Bailey 04:40 2025-06-12 UTC+2

Bitcoin: Dollar Strength Could Trigger a Downturn in the Crypto Market

Today, the market's main focus will be the release of the U.S. inflation report, which is expected to show not only a halt in the recent decline but the highest

Pati Gani 11:47 2025-06-11 UTC+2

EUR/USD. June 11th. The U.S. and China Agreed on Nothing

On Tuesday, the EUR/USD pair continued to move sideways between the levels of 1.1380 and 1.1454. A new rebound from the 61.8% Fibonacci retracement level at 1.1380 enabled another rise

Samir Klishi 11:12 2025-06-11 UTC+2

GBP/USD. June 11th. UK Unemployment and US Inflation

On the hourly chart, the GBP/USD pair continued its decline on Tuesday, consolidated below the 161.8% Fibonacci level at 1.3520, and rebounded from it from below. Thus, the decline

Samir Klishi 10:56 2025-06-11 UTC+2
Can't speak right now?
Ask your question in the chat.
 

Dear visitor,

Your IP address shows that you are currently located in the USA. If you are a resident of the United States, you are prohibited from using the services of InstaFintech Group including online trading, online transfers, deposit/withdrawal of funds, etc.

If you think you are seeing this message by mistake and your location is not the US, kindly proceed to the website. Otherwise, you must leave the website in order to comply with government restrictions.

Why does your IP address show your location as the USA?

  • - you are using a VPN provided by a hosting company based in the United States;
  • - your IP does not have proper WHOIS records;
  • - an error occurred in the WHOIS geolocation database.

Please confirm whether you are a US resident or not by clicking the relevant button below. If you choose the wrong option, being a US resident, you will not be able to open an account with InstaTrade anyway.

We are sorry for any inconvenience caused by this message.