See also
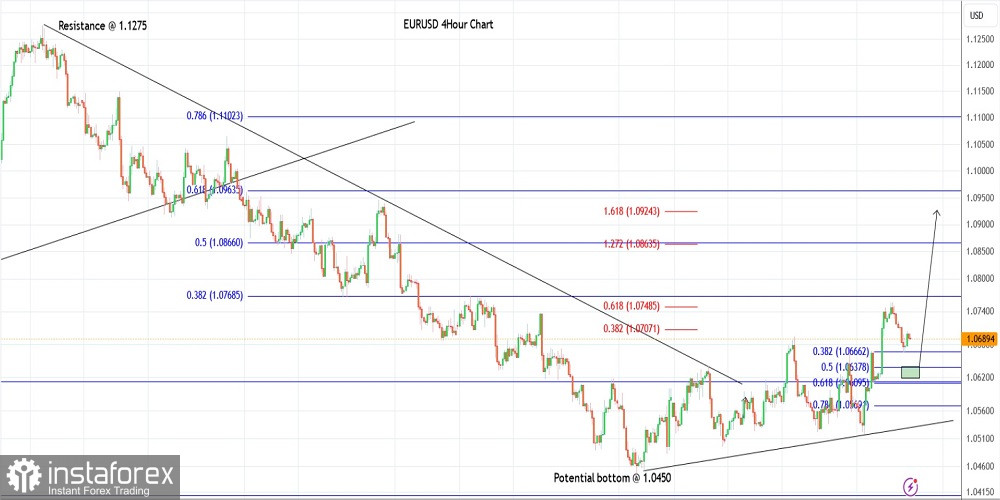
EUR/USD is pulling back after hitting the 1.0755-60 potential resistance defined earlier. The single currency pair found initial support around the 1.0680 mark as projected and we can expect an intraday bounce towards 1.0725 at least before bears are back in control. Also, note that 1.0680 is the Fibonacci 0.382 retracement of the recent upswing between 1.0510 and 1.0755-60 levels as projected on the chart.
EUR/USD has been unfolding a larger degree corrective rally since the 1.0450 lows printed on October 04, 2023. The currency pair hit its initial Fibonacci targets at the 1.0755-60 range early this week. Bears are potentially unfolding a Gartley corrective wave, which could be completed around the 1.0630 mark by next week.
Bulls of the euro would be poised to come back in control thereafter (from 1.0630) and push through the next Fibonacci extensions seen towards 1.0825 and potentially up to the 1.0900 mark. Also, note that 1.0900-30 is the Fibonacci 0.618 retracement of the entire drop between 1.1275 and 1.0450 respectively. High probability remains for a bearish reversal thereafter.
Potential rally through 1.0830 against 1.0400
Good luck!
You have already liked this post today
*The market analysis posted here is meant to increase your awareness, but not to give instructions to make a trade.
On Friday, the GBP/USD currency pair saw only a slight correction after its strong rally. Once again, we observe a market with no apparent desire to take profits from long
On Friday, the EUR/USD currency pair stood still. Once again, we are observing a situation where the price rises (often strongly) for some time and then just waits. It waits
Analysis of Friday's Trades 1H Chart of GBP/USD The GBP/USD pair also traded rather calmly on Friday. However, unlike the EUR/USD pair, traders didn't find it necessary to react
Analysis of Friday's Trades 1H Chart of EUR/USD The EUR/USD currency pair showed no significant movements on Friday. For most of the day, the price remained in a sideways range
In my morning forecast, I highlighted the 1.3720 level and planned to make trading decisions based on it. Let's take a look at the 5-minute chart and examine what happened
In my morning forecast, I highlighted the 1.1709 level and planned to make trading decisions based on it. Let's take a look at the 5-minute chart and analyze what happened
Analysis of Thursday's Trades 1H Chart of GBP/USD On Thursday, the GBP/USD pair also remained in an upward trend, and there was no shortage of significant developments across the Atlantic
Analysis of Thursday's Trades 1H Chart of EUR/USD On Thursday, the EUR/USD currency pair traded mostly sideways, albeit with a slight upward bias. The uptrend on the hourly timeframe remains
The EUR/USD currency pair continued its strong upward movement throughout Thursday. A new wave of growth for the European currency began on Wednesday evening and continued into Thursday night. Therefore
Your IP address shows that you are currently located in the USA. If you are a resident of the United States, you are prohibited from using the services of InstaFintech Group including online trading, online transfers, deposit/withdrawal of funds, etc.
If you think you are seeing this message by mistake and your location is not the US, kindly proceed to the website. Otherwise, you must leave the website in order to comply with government restrictions.
Why does your IP address show your location as the USA?
Please confirm whether you are a US resident or not by clicking the relevant button below. If you choose the wrong option, being a US resident, you will not be able to open an account with InstaTrade anyway.
We are sorry for any inconvenience caused by this message.