See also

 30.11.2023 12:16 PM
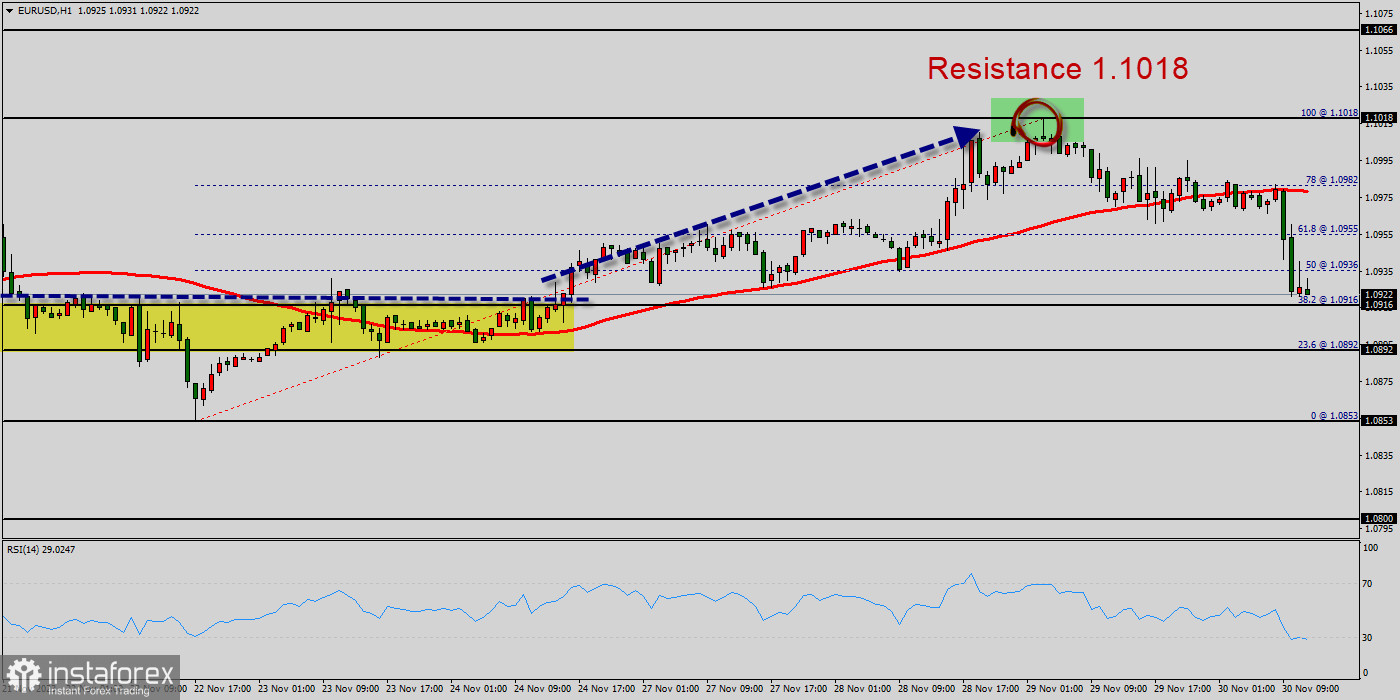
Overview :
The EUR/USD pair dropped sharply from the level of 1.1018 towards 1.0921. Now, the price is set at 1.0921. On the H1 chart, the resistance is observed at the levels of 1.1018 and 1.0980. Volatility is very high for that the EUR/USD pair is still expected to be moving between 1.0980 and 1.0892 in coming hours. In the short term, we expect the EUR/USD pair to continue to trade in a beairsh trend from the new support level of 1.0916 to form a bearish channel.
Also, it should be noted that major resistance is seen at 1.1018, while immediate resistance is found at 1.0980. According to the previous events, the pair is likely to move from 1.0980 towards 1.0916 and 1.0892 as targets. In the H1 time frame:
However, if the pair fails to pass through the level of 1.0980, the market will indicate a bearish opportunity below the level of 1.0980. So, the market will decline further to 1.0892 in order to return to the daily support 2. Moreover, a breakout of that target will move the pair further downwards to 1.0853.
On the other hand, the daily strong resistance is seen at 1.1018. If the EUR/USD pair is able to break out the level of 1.1018, the market will climb further to 1.1066 (daily resistance 2).
You have already liked this post today
*The market analysis posted here is meant to increase your awareness, but not to give instructions to make a trade.


