empty
07.12.2023 05:52 AM
EUR/USD H4 | Bullish Bounce?

This image is no longer relevant

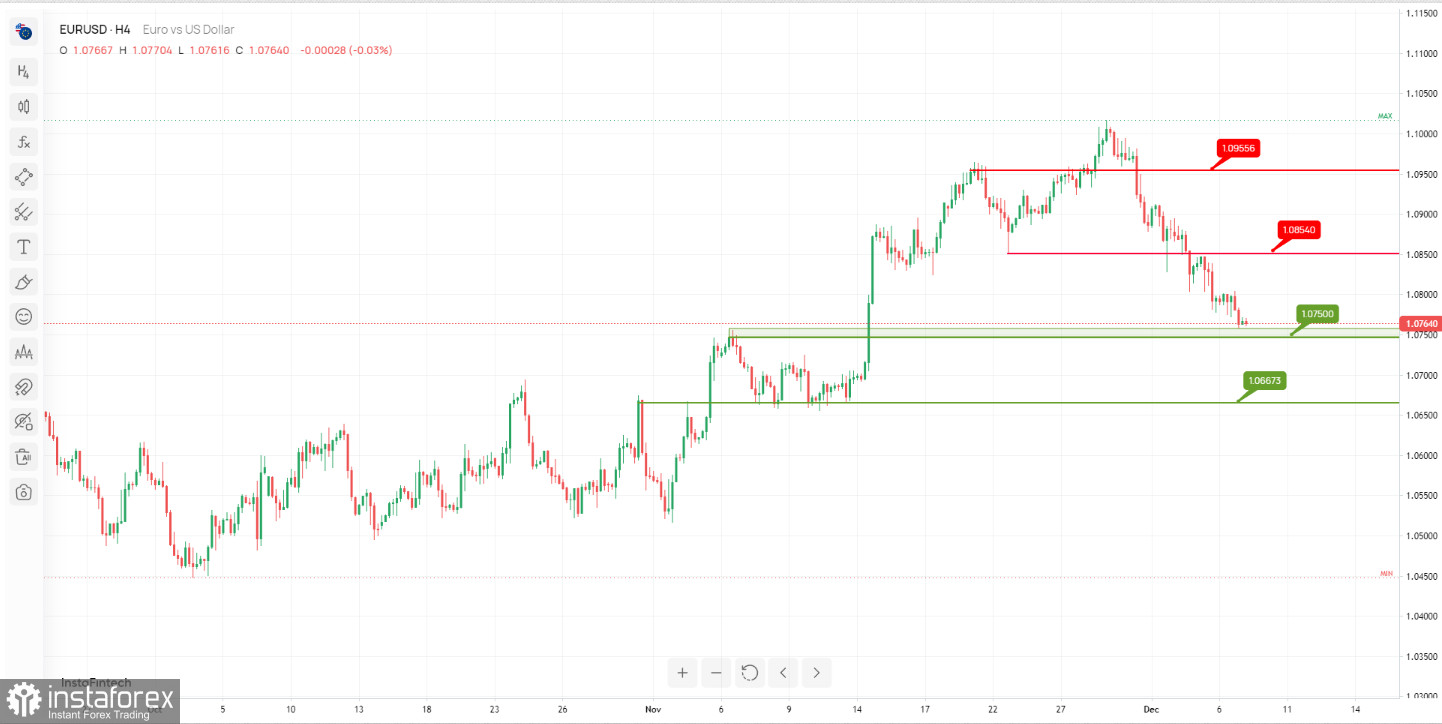
The EUR/USD chart suggests the potential for a bullish bounce, with significant support and resistance levels influencing its prospective direction.

Support Levels:

At 1.07500, the 1st support is characterized as "Pullback support." This level implies a zone where buying interest may emerge, potentially facilitating a bounce. Similarly, the 2nd support at 1.06673 is identified as "An Overlap support," indicating its potential significance in providing support to the price.

Resistance Levels:

On the resistance side, the 1st resistance level at 1.08540 is labeled as "An Overlap resistance." This level represents a significant barrier to further upward price movement and should be closely monitored by traders. Additionally, the 2nd resistance at 1.09556 is categorized as "Pullback resistance," highlighting its role as a significant resistance zone due to its alignment with key technical levels.

Dean Leo,
Analytical expert of InstaTrade
© 2007-2025

Recommended Stories

XAU/USD. Analysis and Forecast

Gold is currently holding on to its intraday losses. Overall positive sentiment in the stock markets is undermining demand for bullion. However, a combination of factors is preventing bears from

Irina Yanina 12:18 2025-06-16 UTC+2

Forecast for EUR/USD on June 16, 2025

On Friday, the EUR/USD pair reversed in favor of the U.S. dollar and consolidated below the 100.0% Fibonacci correction level at 1.1574. This did not happen without reason, which

Samir Klishi 12:02 2025-06-16 UTC+2

Forex forecast 16/06/2025: EUR/USD, GBP/USD, USD/JPY, Oil, Gold and Bitcoin

Useful links: My other articles are available in this section InstaForex course for beginners Popular Analytics Open trading account Important: The begginers in forex trading need to be very careful

Sebastian Seliga 10:30 2025-06-16 UTC+2

GBP/USD – June 16th: Bulls Hold the 1.3527 Level

On the hourly chart, the GBP/USD pair on Friday rebounded twice from the 127.2% Fibonacci retracement level at 1.3527 and rose toward the resistance zone of 1.3611–1.3633. However, prior

Samir Klishi 10:27 2025-06-16 UTC+2

Technical Analysis of Daily Price Movement of USD/IDR Exotic Currency Pairs, Monday June 16, 2025.

With the appearance of the Bullish 123 pattern in the midst of the weakening conditions of this exotic currency pair, that has been confirmed by the movement of the USD/IDR

Arief Makmur 07:16 2025-06-16 UTC+2

Technical Analysis of Intraday Price Movement of Crude Oil Commodity Instrument, Monday June 16, 2025.

On the 4-hour chart of the Crude Oil commodity instrument, there is an appearance of Divergence between the #CL price movement and the Stochastic Oscillator indicator, indicating that

Arief Makmur 07:16 2025-06-16 UTC+2

Trading Signals for EUR/USD for June 13-19, 2025: buy above 1.1500 (21 SMA - 7/8 Murray)

Under the opposite scenario, if the euro falls below 1.1490, it is likely to reach the 200 EMA, which is located at 1.1340 and coincides with the bottom

Dimitrios Zappas 14:14 2025-06-13 UTC+2

Trading Signals for GOLD for June 13-19, 2025: sell below 3,343 (21 SMA - 8/8 Murray)

Gold has left a gap at 3,282 and another around 3,181. So, if the price falls below the psychological level of 3,300, we could expect it to fall to cover

Dimitrios Zappas 14:12 2025-06-13 UTC+2

Forecast for EUR/USD on June 13, 2025

On Thursday, the EUR/USD pair continued its upward movement and consolidated above the 100.0% Fibonacci retracement level at 1.1574. However, during the night, a sharp reversal occurred in favor

Samir Klishi 11:52 2025-06-13 UTC+2

Forecast for GBP/USD on June 13, 2025

On the hourly chart, the GBP/USD pair on Thursday rebounded from the 1.3520 level, surged to the resistance zone of 1.3611–1.3620, bounced off it twice, and then fell back

Samir Klishi 11:49 2025-06-13 UTC+2
Can't speak right now?
Ask your question in the chat.
 

Dear visitor,

Your IP address shows that you are currently located in the USA. If you are a resident of the United States, you are prohibited from using the services of InstaFintech Group including online trading, online transfers, deposit/withdrawal of funds, etc.

If you think you are seeing this message by mistake and your location is not the US, kindly proceed to the website. Otherwise, you must leave the website in order to comply with government restrictions.

Why does your IP address show your location as the USA?

  • - you are using a VPN provided by a hosting company based in the United States;
  • - your IP does not have proper WHOIS records;
  • - an error occurred in the WHOIS geolocation database.

Please confirm whether you are a US resident or not by clicking the relevant button below. If you choose the wrong option, being a US resident, you will not be able to open an account with InstaTrade anyway.

We are sorry for any inconvenience caused by this message.