empty
05.01.2024 11:44 AM
Technical Analysis of GBP/USD for January 5, 2024

GBP/USD Technical Analysis: Navigating Market Uncertainty

Top Insights:

  1. Short-term Bearish Reversal: The GBP/USD pair shows signs of a bearish reversal, marked by a Bearish Engulfing pattern.
  2. Bullish Long-Term Outlook: Despite short-term fluctuations, long-term indicators suggest a bullish trend.
  3. Critical Levels to Monitor: Key support and resistance levels offer insights into potential market movements.

Global Market Context

The Asia-Pacific indices show mixed trends, with China's indices down by about 0.50-0.60% and Japan's Nikkei 225 slightly up by 0.40%. Forex markets remain calm, with most currency pairs showing minimal changes. The USD strengthens, while the JPY weakens, as seen in the USDJPY pair's rise.

This image is no longer relevant

Political Tensions Affecting Markets

Recent events in North Korea, involving artillery shells fired into the sea, add to regional tensions. Such geopolitical factors can influence currency markets, impacting pairs like GBP/USD.

Technical Analysis: A Closer Look

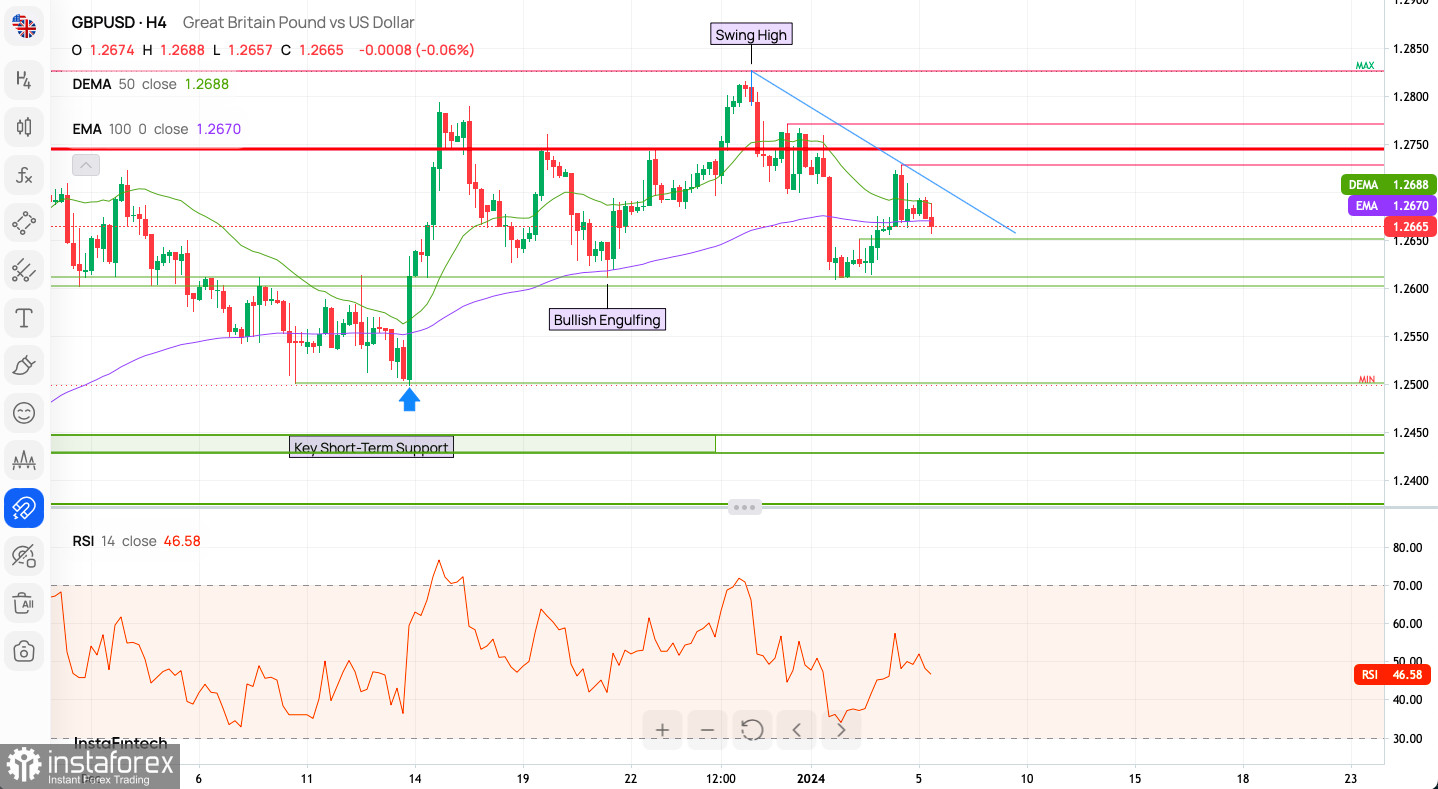
  • Bearish Engulfing Pattern: The GBP/USD pair shows this pattern at the top of its recent move, suggesting a potential downward trend.
  • Support and Resistance: Intraday support lies at 1.2651 and 1.2608, with resistance at 1.2670 and 1.2699.
  • Momentum Analysis: The H4 chart shows weak, negative momentum. A breakout above 1.2699 could shift the outlook back to bullish.

This image is no longer relevant

Indicator Insights

  • Bullish Engulfing Pattern: This pattern, typically a bullish signal, suggests a reversal from a downtrend.
  • Moving Averages: The near overlap of the 50-period DEMA and 100-period EMA, with the DEMA slightly above, is a bullish indicator.
  • RSI Analysis: The RSI at 46.58 indicates a neutral market, without strong buying or selling pressure.

Market Sentiment and Indicator Signals

  • H1 Intraday Indicators: Most indicators show a sell signal, with a few neutral, and one indicating a buy.
  • Sentiment Scoreboard: General sentiment is bullish, with a majority favoring the bulls over the last week and recent days.

Weekly Pivot Points

  • Key Levels: Resistance at WR3 (1.28261) and support at WS3 (1.26053).
  • Trading Focus: Monitoring these levels can provide insights for potential trend reversals or continuations.

Long-Term Trading Perspective

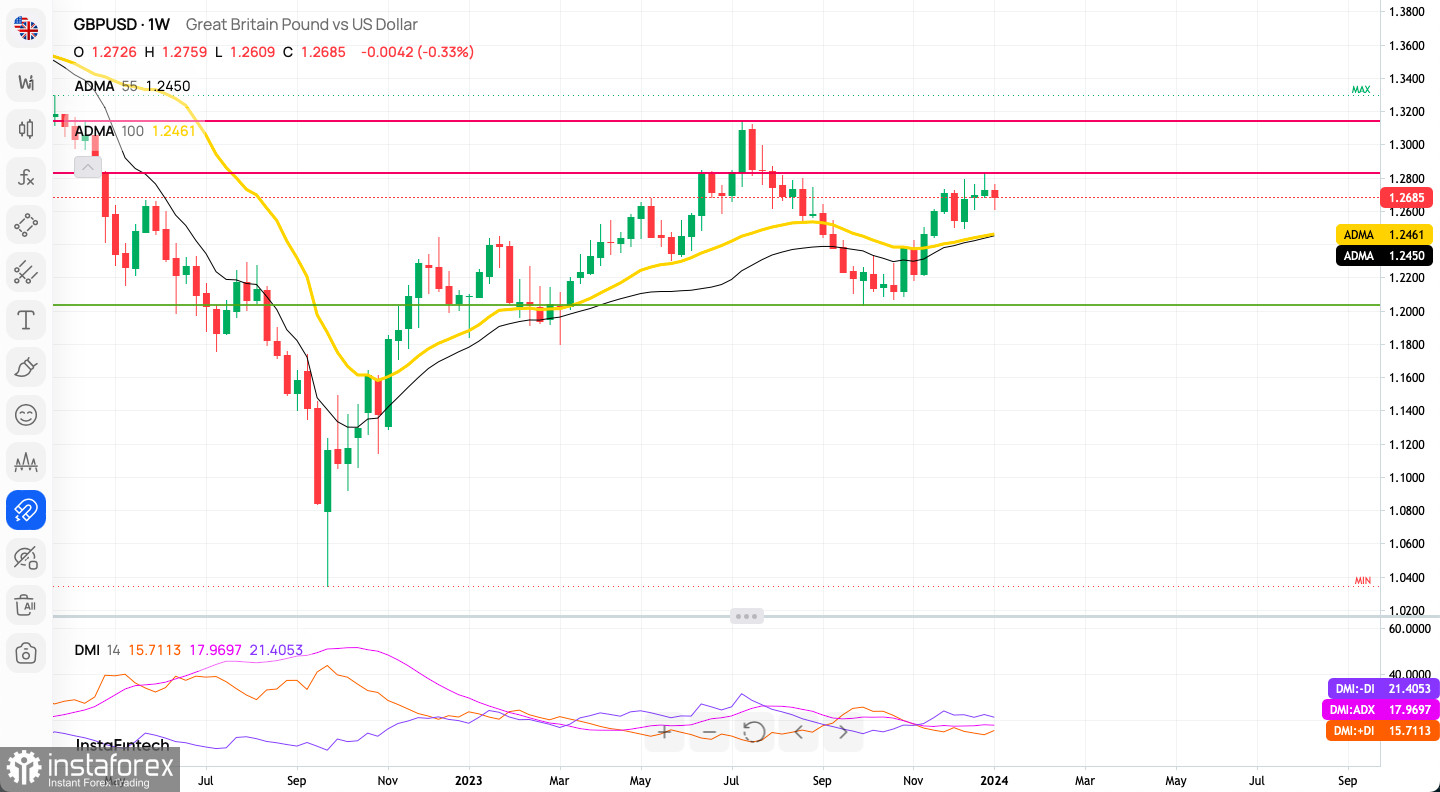
  • Bullish Candlestick Pattern: A decisive Bullish Engulfing pattern on the weekly chart suggests strong bullish sentiment.
  • Market Above WMAs: Trading above the 50 and 100 WMAs underlines the bullish trend, targeting the 2023 high at 1.3141.
  • Critical Support: A sustained break below 1.1802 could signal a major bearish movement.

This image is no longer relevant

Conclusion: A Balanced Approach

For bullish traders, maintaining positions above key support levels aligns with the long-term uptrend. However, bearish traders should watch for breaks below these levels. Always consider both technical and fundamental factors for a comprehensive approach to trading.

Recommended Stories

GBP/USD Forecast for June 12, 2025

On Wednesday, the British pound successfully avoided a decline below technical support levels, reversing upward from them. The price rebounded from the MACD indicator line on the daily chart, while

Laurie Bailey 04:40 2025-06-12 UTC+2

USD/JPY Forecast for June 12, 2025

The price correction since May 27 was complex and prolonged, posing a risk of a breakout above 146.11. However, this risk is no longer a concern with the reversal from

Laurie Bailey 04:40 2025-06-12 UTC+2

Bitcoin: Dollar Strength Could Trigger a Downturn in the Crypto Market

Today, the market's main focus will be the release of the U.S. inflation report, which is expected to show not only a halt in the recent decline but the highest

Pati Gani 11:47 2025-06-11 UTC+2

EUR/USD. June 11th. The U.S. and China Agreed on Nothing

On Tuesday, the EUR/USD pair continued to move sideways between the levels of 1.1380 and 1.1454. A new rebound from the 61.8% Fibonacci retracement level at 1.1380 enabled another rise

Samir Klishi 11:12 2025-06-11 UTC+2

GBP/USD. June 11th. UK Unemployment and US Inflation

On the hourly chart, the GBP/USD pair continued its decline on Tuesday, consolidated below the 161.8% Fibonacci level at 1.3520, and rebounded from it from below. Thus, the decline

Samir Klishi 10:56 2025-06-11 UTC+2

Technical Analysis of Intraday Price Movement of AUD/JPY Cross Currency Pairs, Wednesday June 11, 2025.

From what is seen on the 4-hour chart, the AUD/JPY cross currency pair appears to have a Divergence between the AUD/JPY price movement and the Stochastic Oscillator indicator, so based

Arief Makmur 09:28 2025-06-11 UTC+2

Technical Analysis of Daily Price Movement of USD/IDR Exotic Currency Pairs, Wednesday June 11, 2025.

There are some interesting facts about USD/IDR at the moment, first the price movement of USD/IDR is moving below WMA (21), second the appearance of Bearish 123 pattern followed

Arief Makmur 09:28 2025-06-11 UTC+2

Trading Signals for BITCOIN (BTC/USD) for June 11-13: sell below $110,700 (21 SMA - 200 EMA)

Bitcoin is trading around 110,726, undergoing a technical correction after reaching 110,726, a level seen at the end of May. Bitcoin has formed a double top pattern, so we believe

Dimitrios Zappas 05:16 2025-06-11 UTC+2

Trading Signals for GOLD (XAU/USD) for June 11-14: 2025 sell below $3,340 (21 SMA - 7/8 Murray)

Early in the European session, gold is trading around 3,334, showing exhaustion, as it bounced above 3,300 during yesterday's American session. This price level for gold

Dimitrios Zappas 05:09 2025-06-11 UTC+2

EUR/USD Forecast for June 11, 2025

Yesterday, the US dollar attempted to push the euro below key technical support levels marked by the daily Balance and MACD indicator lines, but the euro withstood the pressure

Laurie Bailey 04:41 2025-06-11 UTC+2
Can't speak right now?
Ask your question in the chat.
 

Dear visitor,

Your IP address shows that you are currently located in the USA. If you are a resident of the United States, you are prohibited from using the services of InstaFintech Group including online trading, online transfers, deposit/withdrawal of funds, etc.

If you think you are seeing this message by mistake and your location is not the US, kindly proceed to the website. Otherwise, you must leave the website in order to comply with government restrictions.

Why does your IP address show your location as the USA?

  • - you are using a VPN provided by a hosting company based in the United States;
  • - your IP does not have proper WHOIS records;
  • - an error occurred in the WHOIS geolocation database.

Please confirm whether you are a US resident or not by clicking the relevant button below. If you choose the wrong option, being a US resident, you will not be able to open an account with InstaTrade anyway.

We are sorry for any inconvenience caused by this message.