See also

 16.01.2024 05:54 AM
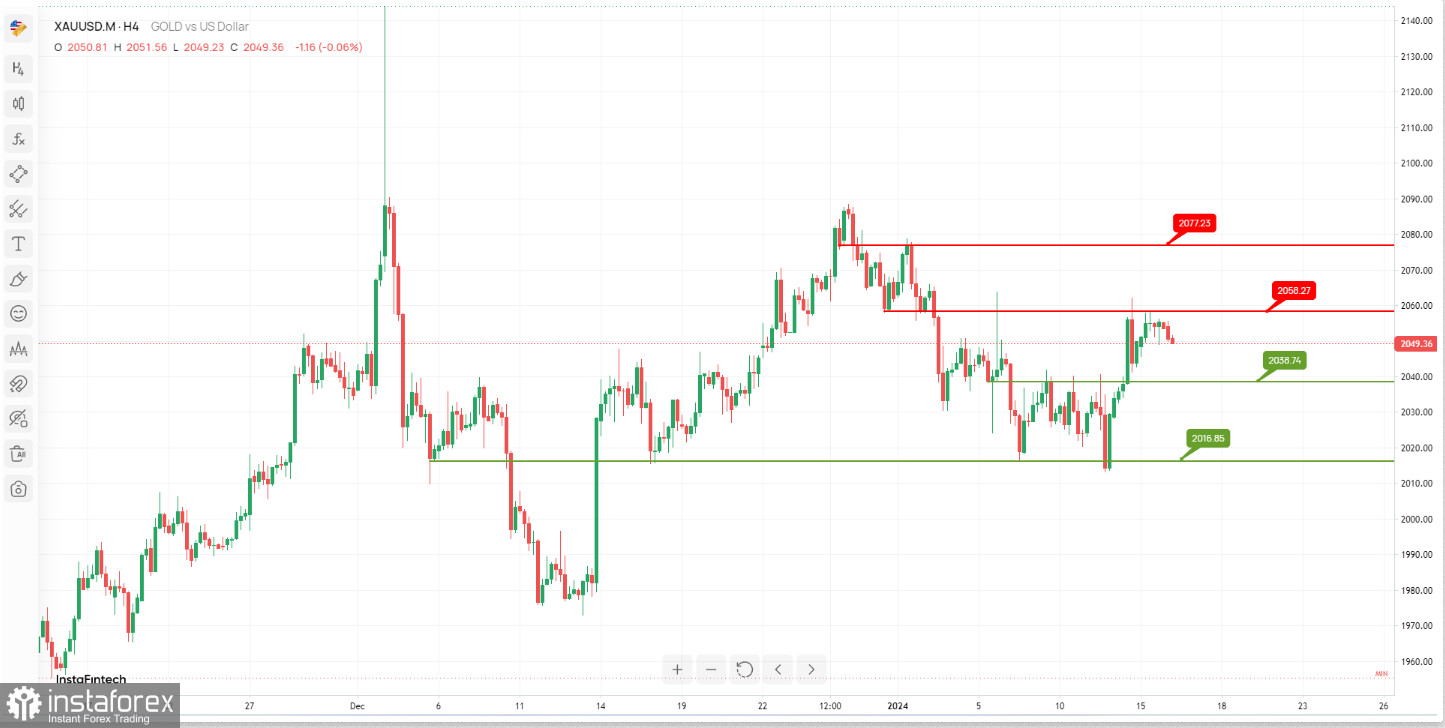
The XAU/USD (Gold/US Dollar) chart suggests a potential bearish scenario with a focus on continuing towards the support levels. Here are the key support and resistance levels:
Resistance Levels:
The 1st resistance level at 2058.27 is identified as "An Overlap resistance." This level may act as a significant barrier to further upward movement in the price of gold.
The 2nd resistance level at 2077.23 is also labeled as "An Overlap resistance." It represents another level where selling pressure could potentially emerge and limit any bullish momentum.
Support Levels:
The 1st support level at 2038.74 is marked as "Pullback support." This level could attract buying interest and serve as a potential area of price reversal or consolidation.
The 2nd support level at 2016.85 is identified as "An Overlap support." It represents another important support zone where traders might consider entering long positions.
You have already liked this post today
*The market analysis posted here is meant to increase your awareness, but not to give instructions to make a trade.


