See also

 18.01.2024 05:19 AM
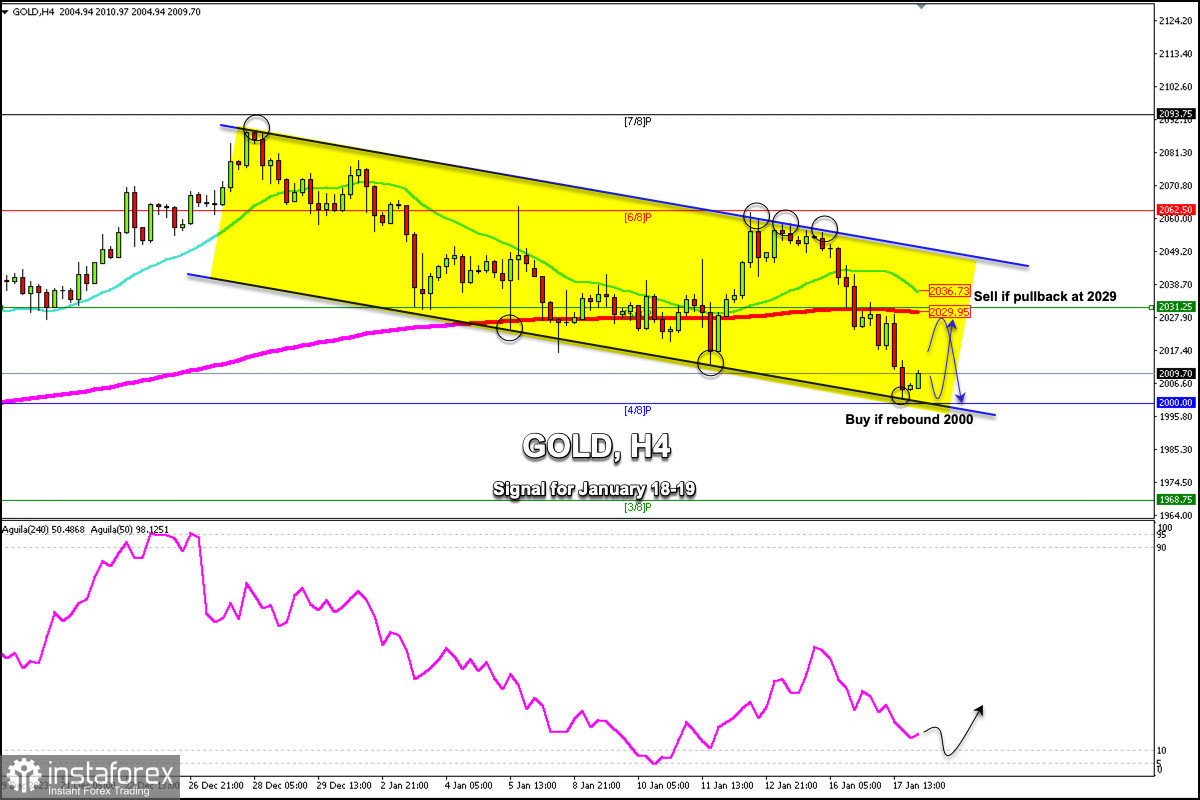
Early in the European session, gold is trading around 2,009.70, below the 21 SMA, and below the 200 EMA. We can see on the H4 chart that gold has been trading within a bearish trend channel forming since December 26. Yesterday, it reached the bottom of this channel around the $2,001.76 level.
The fall of gold accelerated after it broke the 200 EMA located at 2,030, failing to consolidate above this level. We saw a strong downward acceleration with the price reaching the low of 2,001.
One factor weakening the strength in gold was the good retail sales data from the US which pushed up Treasury bond yields and in turn, this weakened the strength of the XAU.
We invite you to review our previous analyses regarding gold. Yesterday, we indicated strong selling pressure supported by technical indicators and we saw that we obtained good results.
If gold consolidates above the psychological level of $2,000 in the next few hours, we could expect a technical rebound and the price could reach the EMA at 2,029. If this scenario occurs, it could be seen as an opportunity to buy with targets at 2,010, 2,018, and 2,029. A stop loss should be placed in case gold falls below the psychological level.
If gold drops below the psychological level of $2,000, we could expect a strong bearish acceleration and the instrument could reach 3/8 Murray at 1,968, but due to the oversold levels, there will likely be a technical rebound above the psychological level of $2,000 for the next few days.
You have already liked this post today
*The market analysis posted here is meant to increase your awareness, but not to give instructions to make a trade.


