empty
14.09.2023 01:59 PM
EUR/USD and GBP/USD: Technical analysis for September 14

EUR/USD

This image is no longer relevant

Higher Timeframes

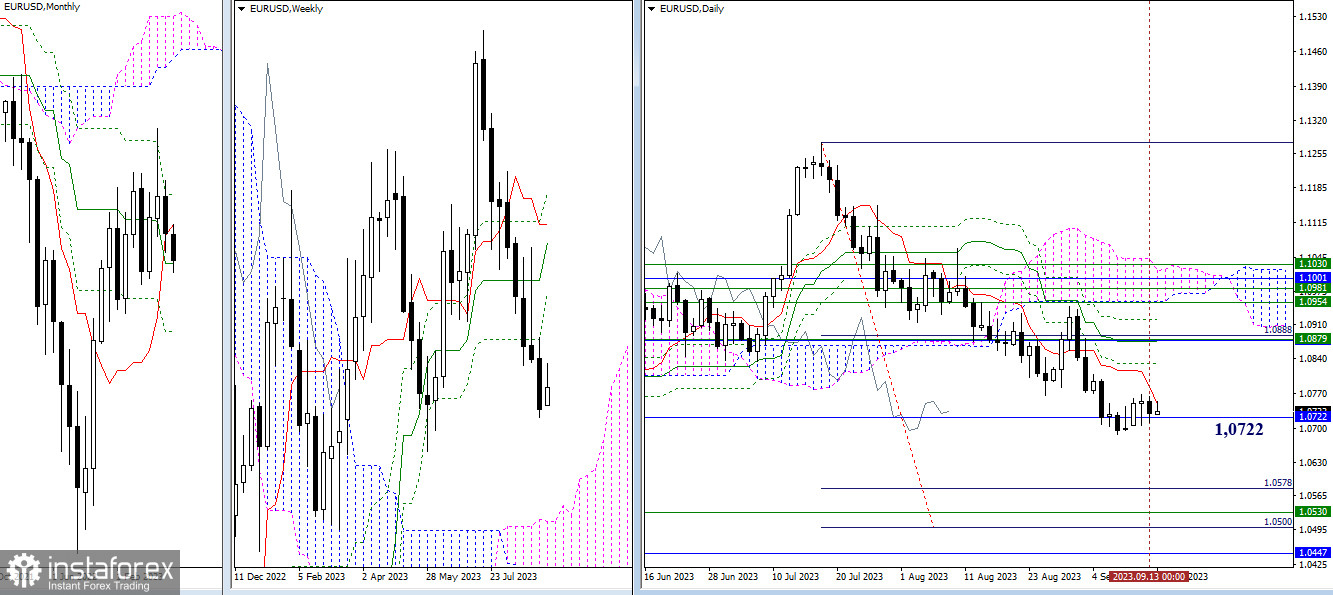
The situation has remained virtually unchanged for the past day. The daily consolidation with the center of attraction at 1.0722 (monthly medium-term trend) persists. The daily short-term trend has descended into the consolidation zone (1.0748). Other reference points mentioned earlier remain in place. For bullish players, the most important area during an upward trend will be the region between 1.0875–79 (daily medium-term trend + monthly short-term trend + weekly Fibonacci Kijun), with intermediate resistance at 1.0830 (daily Fibonacci Kijun). For bearish players after the correction is completed, the support zone is of interest, including the daily target for breaking the Ichimoku cloud (1.0500 - 1.0578), the upper boundary of the weekly cloud (1.0530), and the final level of the monthly Ichimoku cross (1.0447).

This image is no longer relevant

H4 - H1

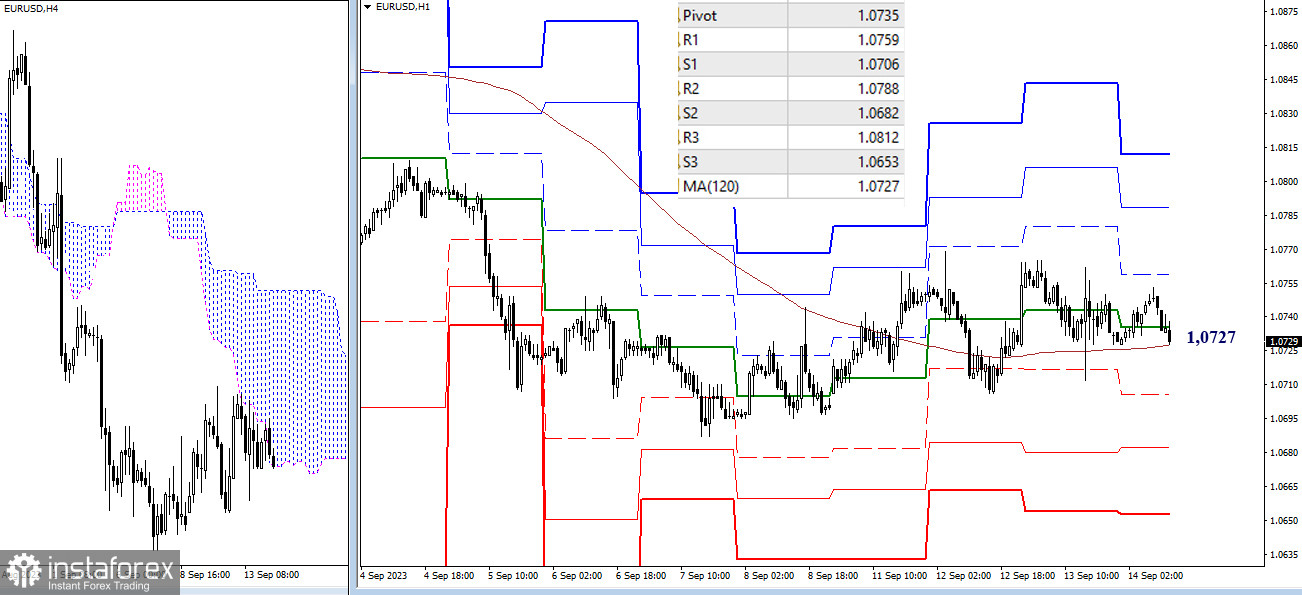
On lower timeframes, the situation continues to be restrained by the weekly long-term trend (1.0727), which is currently almost horizontal. These circumstances indicate ongoing uncertainty in the movement's development, as confirmed by the daily consolidation. The classic pivot points serve as references for intraday movement development. For bullish players, the important resistances are 1.0759 - 1.0788 - 1.0812, while for bearish players, the supports that may come in handy are 1.0706 - 1.0682 - 1.0653.

***

GBP/USD

This image is no longer relevant

Higher Timeframes

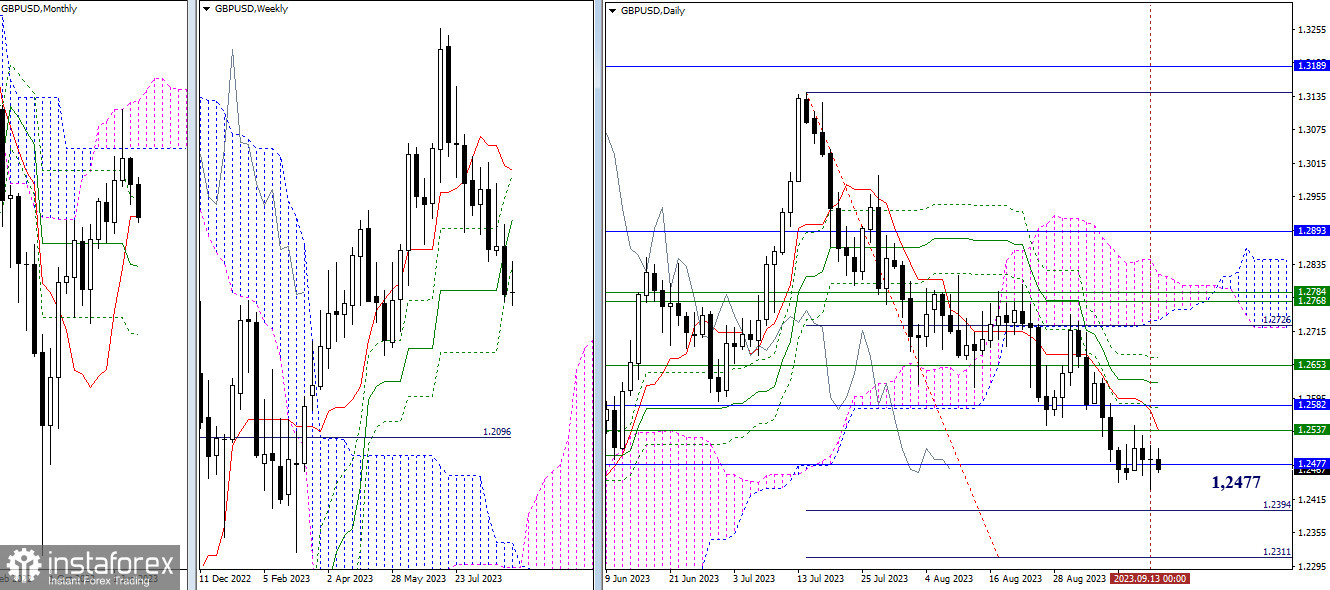
The attraction and influence of the monthly short-term trend (1.2477) continue to restrain market activity, so the main conclusions and expectations remain the same. It is worth noting that the location of the target reference points is also unchanged. Thus, in the event of increasing bearish sentiment, attention will be directed to achieving the daily target for breaking the Ichimoku cloud (1.2394 - 1.2311), and in the case of bullish activity, it will be crucial to pass through 1.2537 - 1.2582 (weekly and monthly Fibonacci Kijun + daily short-term trend).

This image is no longer relevant

H4 - H1

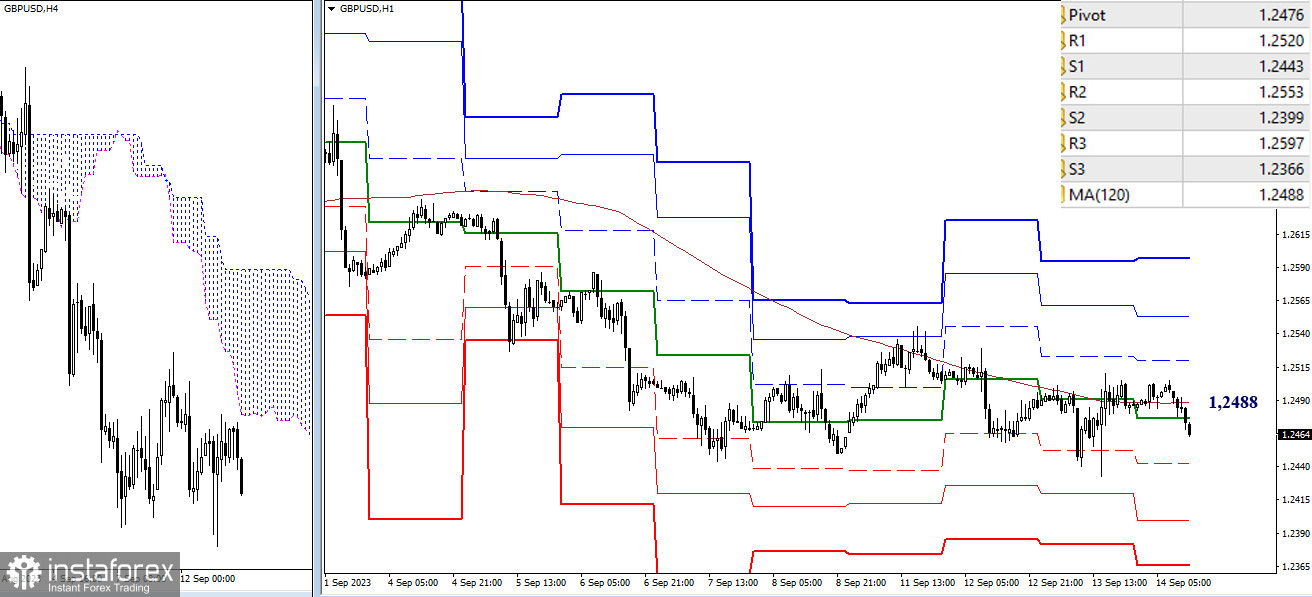
On lower timeframes, the situation has not changed. The weekly long-term trend (1.2488) continues to restrain movement development, and the market remains within its attraction and influence zone. If the situation changes within the day, the classic pivot points (1.2443 - 1.2399 - 1.2366) will be significant for the bearish players, while the resistances of the classic pivot points (1.2520 - 1.2553 - 1.2597) will be significant for the bulls.

***

The technical analysis of the situation uses:

Higher timeframes - Ichimoku Kinko Hyo (9.26.52) + Fibo Kijun levels

Lower timeframes - H1 - Pivot Points (classic) + Moving Average 120 (weekly long-term trend)

Evangelos Poulakis,
Analytical expert of InstaTrade
© 2007-2025

Recommended Stories

If Crude Oil manages to break below the Pivot level, it has the potential to test its nearest Support level, Thursday, July 03, 2025.

Crude Oil, Thursday, July 03, 2025. Poor global economic conditions such as the stagnation of Chinese & European manufacturing have triggered concerns about global Crude Oil demand and expectations

Arief Makmur 07:36 2025-07-03 UTC+2

The Nasdaq 100 index has the potential to test its closest Resistance level, Thursday, July 03, 2025.

Nasdaq 100 Index, Thursday, July 03, 2025. Positive Big Tech Company financial reports and the increasingly strong rumors of the Fed's Dovish policy and the rise of AI innovation have

Arief Makmur 07:36 2025-07-03 UTC+2

EUR/AUD Forecast for July 3, 2025

On the daily chart, the EUR/AUD pair is moving sideways in the upper half of the price channel and above the MACD indicator line. The signal line of the Marlin

Laurie Bailey 06:33 2025-07-03 UTC+2

EUR/USD Forecast for July 3, 2025

Ahead of today's U.S. employment data release for June, the euro consolidated near the price channel line on the daily chart. The long lower shadow of the candlestick suggests that

Laurie Bailey 05:11 2025-07-03 UTC+2

GBP/USD Forecast for July 3, 2025

By the end of yesterday, the British pound had lost 108 pips. Although the reason was not the anticipation of today's U.S. employment data, but rather domestic political turmoil, this

Laurie Bailey 05:11 2025-07-03 UTC+2

Silver Forecast for July 3, 2025

After two days of intense struggle (Monday and Tuesday) between the bulls and bears along the price channel line amid heightened volatility, yesterday we saw the outcome — the bulls

Laurie Bailey 05:11 2025-07-03 UTC+2

Trading Signals for EUR/USD for July 2-5, 2025: sell below 1.1840 (+1/8 Murray - 21 SMA)

If the euro breaks below 1.1762 and consolidates below this price zone, a bearish acceleration is likely and could reach the bottom of the trend channel around 1.1620. It could

Dimitrios Zappas 19:00 2025-07-02 UTC+2

Trading Signals for GOLD (XAU/USD) for July 2-8, 2025: buy above 3,325 (21 SMA - 200 EMA)

Gold could be preparing for a new bullish sequence, so as the price consolidates above 3,325 or 3,312, any technical rebound will be seen as a buying signal, with short-term

Dimitrios Zappas 18:58 2025-07-02 UTC+2

USD/JPY. Analysis, Forecast, and Current Market Situation

Negative oscillators on the 4-hour chart indicate that any further upward movement can be viewed as a selling opportunity. From a technical standpoint, the presence of negative oscillators

Irina Yanina 18:48 2025-07-02 UTC+2

Forex forecast 02/07/2025: EUR/USD, USD/CAD, GBP/USD, Oil and Bitcoin

Useful links: My other articles are available in this section InstaForex course for beginners Popular Analytics Open trading account Important: The begginers in forex trading need to be very careful

Sebastian Seliga 12:12 2025-07-02 UTC+2
Can't speak right now?
Ask your question in the chat.
 

Dear visitor,

Your IP address shows that you are currently located in the USA. If you are a resident of the United States, you are prohibited from using the services of InstaFintech Group including online trading, online transfers, deposit/withdrawal of funds, etc.

If you think you are seeing this message by mistake and your location is not the US, kindly proceed to the website. Otherwise, you must leave the website in order to comply with government restrictions.

Why does your IP address show your location as the USA?

  • - you are using a VPN provided by a hosting company based in the United States;
  • - your IP does not have proper WHOIS records;
  • - an error occurred in the WHOIS geolocation database.

Please confirm whether you are a US resident or not by clicking the relevant button below. If you choose the wrong option, being a US resident, you will not be able to open an account with InstaTrade anyway.

We are sorry for any inconvenience caused by this message.