empty
14.09.2023 03:00 PM
EUR/JPY dynamics scenarios on September 14, 2023

This image is no longer relevant

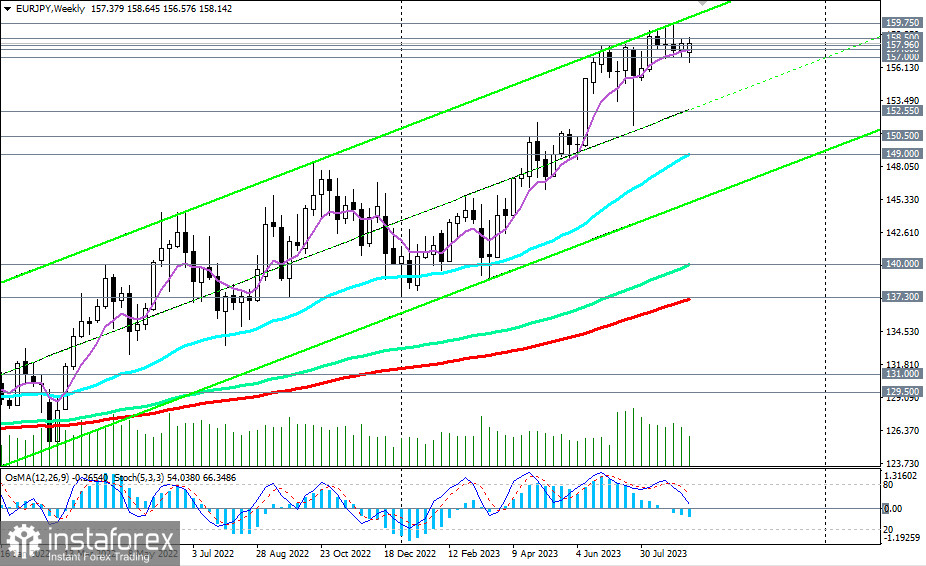
It is widely expected that by the end of its meeting, the European Central Bank's key interest rate and deposit rate for commercial banks will remain at their current levels of 4.25% and 3.75%, respectively, given the growing risks of a recession in the European economy.

However, if ECB President Christine Lagarde sends "hawkish" signals during the press conference following today's meeting, the euro may strengthen sharply. A soft tone in her statements and hints at a pause or a reversal in the direction of the ECB's monetary policy will negatively impact the euro. In this case, we must prepare for further, deeper weakening of the euro, including in major cross-currency pairs, particularly in the EUR/JPY pair.

This image is no longer relevant

Looking at the EUR/JPY chart, it is evident that the pair is experiencing an upward trend, partly due to the divergence in monetary policies between the ECB and the Bank of Japan. In favor of buying the yen and the EUR/JPY pair is also the so-called "carry-trade," where a more expensive currency is bought at the expense of a cheaper one.

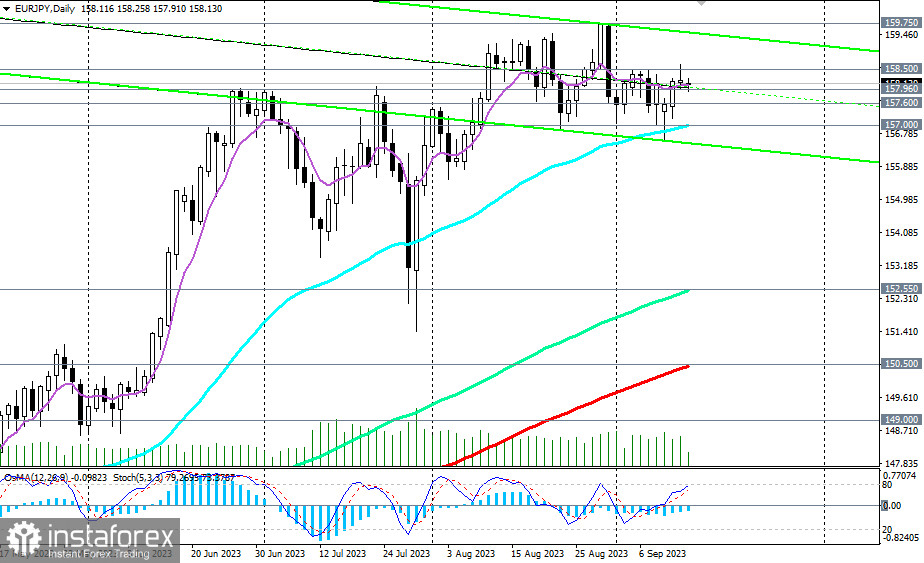
Nevertheless, starting from August, the pair has mainly traded within a wide range between 157.00 (50 EMA on the daily chart) and 159.75 and within a narrower range between 157.60 (200 EMA on the 4-hour chart) and 158.50.

This image is no longer relevant

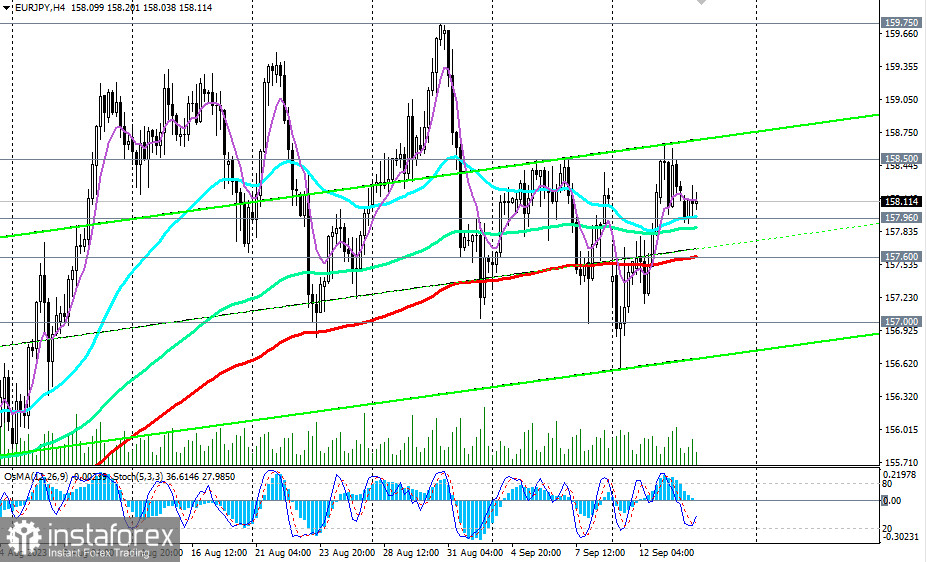
Therefore, a break above the upper level of the short-term range (between 158.50 and 157.60) may be the first signal to increase long positions.

A break of the recent local high at 159.75 (near this level, the upper boundary of the upward channel on the weekly chart also passes) may trigger further growth of the pair, which continues to trade within the long-term bullish trend.

In an alternative scenario, the first signal to open short positions could be a break below the 157.60 mark, with confirmation coming from a break of the important support level at 157.00, targeting a decline near the key support levels 152.55 (144 EMA on the daily chart), 150.50 (200 EMA on the daily chart). Breaking through these levels would break the medium-term bullish trend of the pair, while it would remain within the framework of the long-term bullish trend, above the support levels of 140.00 (144 EMA on the weekly chart) and 137.30 (200 EMA on the weekly chart).

As long as a stable bullish trend and a strong upward momentum prevail, long positions remain preferable.

Support levels: 157.96, 157.60, 157.00, 152.55, 150.50, 149.00

Resistance levels: 158.50, 159.00, 159.75

Jurij Tolin,
Analytical expert of InstaTrade
© 2007-2025

Recommended Stories

Trading Recommendations and Analysis for GBP/USD on June 11: The Pound Pauses Before a New Surge

The GBP/USD currency pair continued trading rather chaotically on Tuesday but with a bearish tone. The British pound at least slightly declined after the trend shifted downward. Recall that

Paolo Greco 03:31 2025-06-11 UTC+2

Trading Recommendations and Analysis for EUR/USD on June 11: Flat Movement at Highs

The EUR/USD currency pair continued to move in both directions throughout Tuesday. These movements indicate a flat market. Let us recall that earlier, the pair broke through the ascending trend

Paolo Greco 03:31 2025-06-11 UTC+2

GBP/USD: Trading Plan for the U.S. Session on June 10th (Review of Morning Trades)

In my morning forecast, I drew attention to the 1.3545 level and planned to base market entry decisions on it. Let's look at the 5-minute chart to see what happened

Miroslaw Bawulski 18:26 2025-06-10 UTC+2

EUR/USD: Trading Plan for the U.S. Session on June 10th (Review of Morning Trades)

In my morning forecast, I highlighted the level of 1.1388 and planned to make market entry decisions based on it. Let's take a look at the 5-minute chart

Miroslaw Bawulski 18:22 2025-06-10 UTC+2

How to Trade the GBP/USD Pair on June 10? Simple Tips and Trade Analysis for Beginners

Analysis of Monday's Trades 1H Chart of GBP/USD The GBP/USD pair also traded in both directions on Monday. On Friday, the price consolidated below the ascending trendline, formally changing

Paolo Greco 06:40 2025-06-10 UTC+2

How to Trade the EUR/USD Pair on June 10? Simple Tips and Trade Analysis for Beginners

Analysis of Monday's Trades 1H Chart of EUR/USD The EUR/USD currency pair traded with low volatility and in both directions on Monday. That day, the macroeconomic backdrop was practically absent

Paolo Greco 06:40 2025-06-10 UTC+2

Trading Recommendations and Analysis for GBP/USD on June 10: The Pound Is in No Hurry to Fall Either

On Monday, the GBP/USD currency pair predictably failed to continue its downward movement. Recall that earlier, the price again formed a signal for a trend reversal to bearish—a consolidation below

Paolo Greco 04:11 2025-06-10 UTC+2

Trading Recommendations and Analysis for EUR/USD on June 10: Another Day, Another Dose of Negativity

The EUR/USD currency pair traded mixed throughout Monday. Despite breaking through the trendline, the downward movement (i.e., strengthening the US dollar) never actually began. Thus, technical signals still hold little

Paolo Greco 04:11 2025-06-10 UTC+2

GBP/USD: Trading Plan for the U.S. Session on June 9th (Analysis of Morning Trades)

In my morning forecast, I focused on the 1.3581 level and planned to base entry decisions around it. Let's look at the 5-minute chart and see what happened. The rise

Miroslaw Bawulski 14:16 2025-06-09 UTC+2

EUR/USD: Trading Plan for the U.S. Session on June 9th (Analysis of Morning Trades)

In my morning forecast, I focused on the 1.1430 level and planned to base entry decisions around it. Let's look at the 5-minute chart and see what happened. The pair

Miroslaw Bawulski 14:09 2025-06-09 UTC+2
Can't speak right now?
Ask your question in the chat.
 

Dear visitor,

Your IP address shows that you are currently located in the USA. If you are a resident of the United States, you are prohibited from using the services of InstaFintech Group including online trading, online transfers, deposit/withdrawal of funds, etc.

If you think you are seeing this message by mistake and your location is not the US, kindly proceed to the website. Otherwise, you must leave the website in order to comply with government restrictions.

Why does your IP address show your location as the USA?

  • - you are using a VPN provided by a hosting company based in the United States;
  • - your IP does not have proper WHOIS records;
  • - an error occurred in the WHOIS geolocation database.

Please confirm whether you are a US resident or not by clicking the relevant button below. If you choose the wrong option, being a US resident, you will not be able to open an account with InstaTrade anyway.

We are sorry for any inconvenience caused by this message.