empty
22.02.2024 02:35 PM
Trading Signals for BITCOIN (BTC/USD) on February 22-25, 2024: sell below $51,300 (+1/8 Murray - symmetrical triangle)

This image is no longer relevant

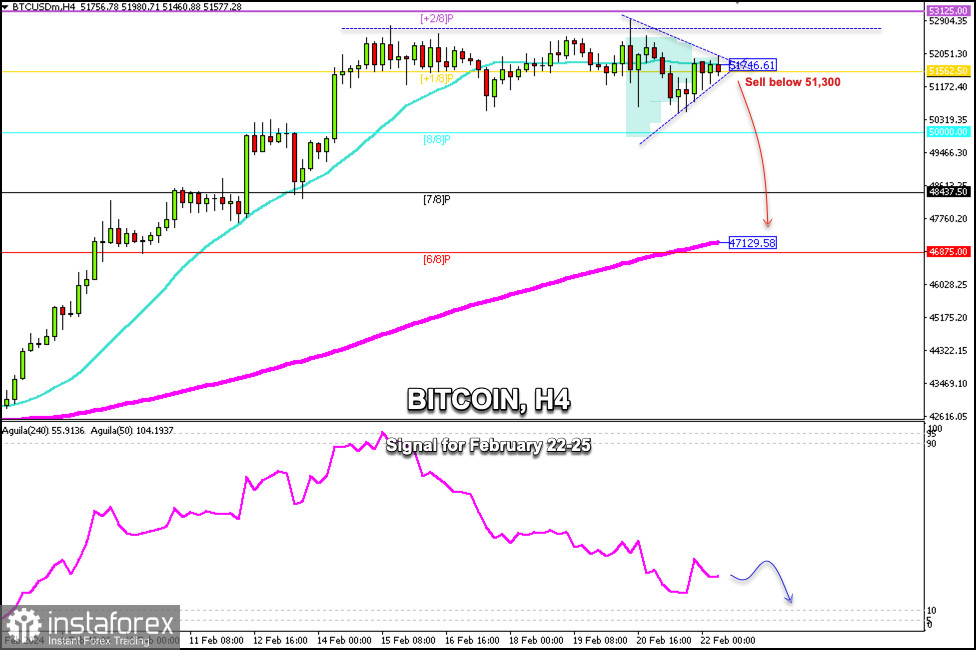
Bitcoin is trading around 51,600, a level that coincides with +1/8 Murray and the 21 SMA. After Bitcoin reached $53,000 on February 13, we observe that it has been consolidating and has been trading between 53,000-50,500 for several days.

On the H4 chart, we observe the formation of a symmetrical triangle pattern. If a break occurs below this pattern around 51,300, we could expect a bearish acceleration in the coming days and BTC could reach the 200 EMA located at 47,129.

On the contrary, should Bitcoin break out of the symmetrical triangle pattern and consolidate above 51,800, we could expect it to continue rising until the price reaches the key +2/8 Murray level located at 53,125.

The eagle indicator is showing oversold signs and BTC is likely to resume its bullish cycle in the coming days which could cause a strong movement in the cryptocurrency. The price could even surpass $53,000 and reach the psychological level of 55,000.

Our outlook could be negative if Bitcoin consolidates below 51,560. Below this area, there is strong bearish pressure and we could expect the price to reach the psychological level of $50,000, 48,437 and finally, 46,875

Dimitrios Zappas,
Analytical expert of InstaTrade
© 2007-2025

Recommended Stories

Forecast for EUR/USD on June 13, 2025

On Thursday, the EUR/USD pair continued its upward movement and consolidated above the 100.0% Fibonacci retracement level at 1.1574. However, during the night, a sharp reversal occurred in favor

Samir Klishi 11:52 2025-06-13 UTC+2

Forecast for GBP/USD on June 13, 2025

On the hourly chart, the GBP/USD pair on Thursday rebounded from the 1.3520 level, surged to the resistance zone of 1.3611–1.3620, bounced off it twice, and then fell back

Samir Klishi 11:49 2025-06-13 UTC+2

EUR/USD. June 12. A Setback for the Dollar

Good day, dear traders! On Wednesday, the EUR/USD pair continued its upward movement after rebounding from the support zone of 1.1374–1.1380. It successfully consolidated above the 76.4% Fibonacci retracement level

Samir Klishi 10:15 2025-06-12 UTC+2

GBP/USD. June 12. British Economy Falters

Good day, dear traders! On the hourly chart, on Wednesday, the GBP/USD pair reversed in favor of the British pound and consolidated above the 161.8% Fibonacci retracement level at 1.3520

Samir Klishi 10:15 2025-06-12 UTC+2

Technical Analysis of Daily Price Movement Crude Oil Commodity Instrument, Thursday June 12, 2025.

If we look at the daily chart of the Crude Oil commodity instrument, there appears to be a Divergence between the price movement of #CL and the Stochastic Oscillator indicator

Arief Makmur 08:10 2025-06-12 UTC+2

Technical Analysis of Intraday Price Movement of Nasdaq 100 Index, Thursday June 12, 2025.

On the 4-hour chart of the Nasdaq 100 index, there is a divergence between its price movement and the Stochastic Oscillator indicator, especially with the current confirmation of the price

Arief Makmur 08:10 2025-06-12 UTC+2

Trading Signals for EUR/USD for June 12-19, 2025: sell below 1.1500 (21 SMA - 8/8 Murray)

If the euro price falls below 1.1500 in the coming hours, this could be seen as an opportunity to sell. Technically, it appears overbought on the H4 chart and could

Dimitrios Zappas 05:33 2025-06-12 UTC+2

Trading Signals for GOLD (XAU/USD) for June 12-19, 2025: sell below $3,386 (21 SMA - 7/8 Murray)

The XAU/USD trend remains bullish as long as the price consolidates above 3,331. Therefore, it would be prudent to buy gold as long as the price consolidates above 3,359, where

Dimitrios Zappas 05:32 2025-06-12 UTC+2

EUR/USD Forecast for June 12, 2025

The U.S. inflation data released on Wednesday stirred the markets: the dollar index dropped by 0.47%, WTI oil surged by 5.54%, gold rose by 1.27%, and 5-year U.S. Treasury yields

Laurie Bailey 04:40 2025-06-12 UTC+2

GBP/USD Forecast for June 12, 2025

On Wednesday, the British pound successfully avoided a decline below technical support levels, reversing upward from them. The price rebounded from the MACD indicator line on the daily chart, while

Laurie Bailey 04:40 2025-06-12 UTC+2
Can't speak right now?
Ask your question in the chat.
 

Dear visitor,

Your IP address shows that you are currently located in the USA. If you are a resident of the United States, you are prohibited from using the services of InstaFintech Group including online trading, online transfers, deposit/withdrawal of funds, etc.

If you think you are seeing this message by mistake and your location is not the US, kindly proceed to the website. Otherwise, you must leave the website in order to comply with government restrictions.

Why does your IP address show your location as the USA?

  • - you are using a VPN provided by a hosting company based in the United States;
  • - your IP does not have proper WHOIS records;
  • - an error occurred in the WHOIS geolocation database.

Please confirm whether you are a US resident or not by clicking the relevant button below. If you choose the wrong option, being a US resident, you will not be able to open an account with InstaTrade anyway.

We are sorry for any inconvenience caused by this message.