empty
08.12.2023 03:30 PM
GBP/USD: trading plan for the US session on December 8th (analysis of morning deals). The pound remains within the channel

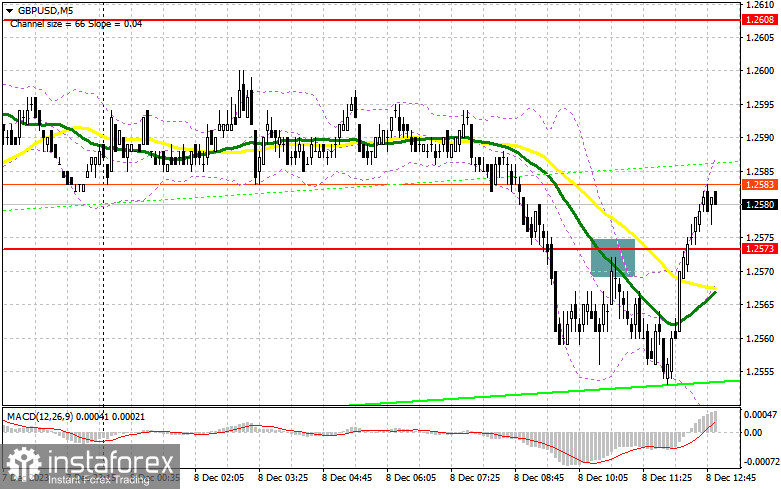
In my morning forecast, I drew attention to the level of 1.2573 and recommended making trading decisions based on it. Let's look at the 5-minute chart and analyze what happened. The breakout and reverse test of this range from bottom to top led to a selling signal, but after a 20-point downward movement, the pressure on the pair weakened, keeping trading within a sideways channel. The technical picture was revised for the second half of the day.

This image is no longer relevant

To open long positions on GBP/USD, the following is required:

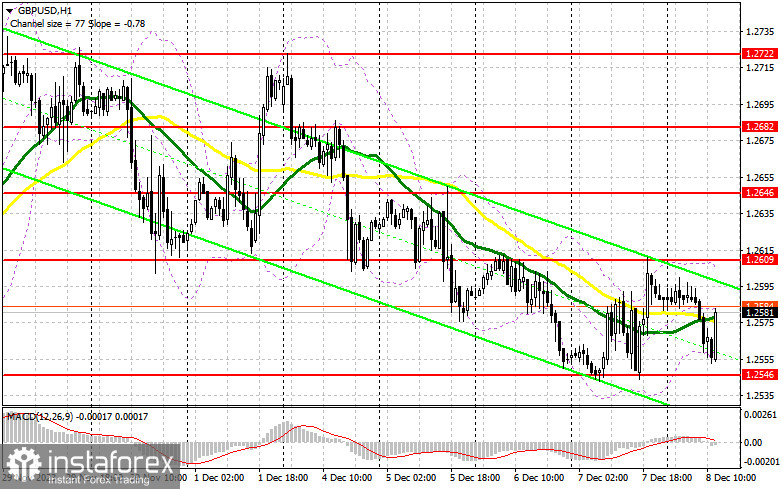
Considering the upcoming data, a significant surge in volatility can be expected. Guessing the pound's direction and trying to understand where it will move during the report release is not in my interest. I will act based on the released statistics. A weak report would result in the growth of the pound and a substantial upward correction by the end of the week. Conversely, a strong report would lead to a decline in the pound, furthering the bearish market trend observed throughout the week. In a sharp decline, someone may show interest around the weekly minimum of 1.2546. A false breakout there will provide a good entry signal with the prospect of movement to around 1.2609. Breaking and consolidating above this range will restore demand for the pound and open the way to 1.2646. The ultimate target will be the area of 1.2682, where I will make profits. In the scenario of a pair decline in the second half of the day and the absence of bullish activity at 1.2546, trading will remain within the framework of a new descending channel. In this case, only a false breakout around the next support at 1.2511 will signal the opening of long positions. I plan to buy GBP/USD immediately on the rebound, only from 1.2478, with a correction target of 30–35 points within the day.

To open short positions on GBP/USD, the following is required:

Sellers control the market, but ahead is labor market data that can turn everything around. I plan to act on the sell side only after the formation of a false breakout around 1.2609, which worked excellently yesterday. Only this will give a chance for a downward movement to the weekly minimum of 1.2544, while breaking and reverse testing from bottom to top of this range will deal a more serious blow to the positions of the bulls, leading to the removal of stop orders and opening the way to 1.2511. A more distant target will be the area of 1.2478, where I will take profits. Testing this level will only strengthen the bearish trend. In the case of GBP/USD growth and the absence of activity at 1.2609 in the second half of the day, buyers will gain an advantage and attempt to regain market control. In this case, I will postpone sales until a false breakout at 1.2646. Without downward movement, I will sell GBP/USD immediately on the rebound from 1.2682, but only counting on a pair correction downward by 30-35 points within the day.

This image is no longer relevant

The COT report (Commitment of Traders) for November 28th showed a sharp increase in long positions and a slight reduction in short positions. The demand for the pound persists, fueled by statements from the Bank of England Governor Andrew Bailey, indicating that the regulator, if not opting for further interest rate hikes, will at least maintain them at their current highs for an extended period. Additionally, the dovish rhetoric from representatives of the Federal Reserve, including Chairman Jerome Powell, contributes to the understanding of why the pound might continue its upward movement soon. Important labor market statistics related to the U.S. will be released soon, which will clarify everything. The latest COT report states that long non-commercial positions increased by 17,996 to 61,296, while short non-commercial positions decreased by 207 to 69,191. As a result, the spread between long and short positions increased by 2,442. The weekly price increased and amounted to 1.2701 against 1.2543.

This image is no longer relevant

Indicator signals:

Moving averages

Trading is carried out around the 30 and 50-day moving averages, indicating a sideways market.

Note: The author determines the period and prices of moving averages on the hourly chart H1 and differs from the general definition of classic daily moving averages on the daily chart D1.

Bollinger Bands

In the event of a decrease, the lower boundary of the indicator, around 1.2555, will act as support.

Indicator Descriptions:

  • Moving average (determines the current trend by smoothing volatility and noise). Period 50. Marked on the chart in yellow.
  • Moving average (determines the current trend by smoothing volatility and noise). Period 30. Marked on the chart in green.
  • MACD indicator (Moving Average Convergence/Divergence). Fast EMA period 12. Slow EMA period 26. SMA period 9.
  • Bollinger Bands. Period 20.
  • Non-commercial traders – speculators, such as individual traders, hedge funds, and large institutions, use the futures market for speculative purposes and meet specific requirements.
  • Long non-commercial positions represent the total long open position of non-commercial traders.
  • Short non-commercial positions represent the total short open positions of non-commercial traders.
  • The total non-commercial net position is the difference between non-commercial traders' short and long positions.
Miroslaw Bawulski,
Analytical expert of InstaTrade
© 2007-2025

Recommended Stories

Trading Recommendations and Analysis for GBP/USD on June 13: Weak GDP Spoiled the Picture for the Pound.

On Thursday, the GBP/USD currency pair continued to move upward. However, somewhat surprisingly, the pound appreciated less this week than the euro. The British currency came under pressure first from

Paolo Greco 03:41 2025-06-13 UTC+2

Trading Recommendations and Analysis for EUR/USD on June 13: Trump Warns of Tariff Hikes

The EUR/USD currency pair continued its strong upward movement on Thursday, which began on Wednesday. A downward pullback started by the end of the day, but it was significantly weaker

Paolo Greco 03:40 2025-06-13 UTC+2

How to Trade the GBP/USD Pair on June 12? Simple Tips and Trade Analysis for Beginners

Analysis of Wednesday's Trades 1H Chart of GBP/USD On Wednesday, the GBP/USD pair moved in a manner similar to the EUR/USD pair. The U.S. inflation report became a new driver

Paolo Greco 06:05 2025-06-12 UTC+2

How to Trade the EUR/USD Pair on June 12? Simple Tips and Trade Analysis for Beginners

Analysis of Wednesday's Trades 1H Chart of EUR/USD On Wednesday, the EUR/USD currency pair resumed its upward trend, lasting more than four months. More precisely, it has continued since Donald

Paolo Greco 06:05 2025-06-12 UTC+2

Trading Recommendations and Analysis for GBP/USD on June 12: The Pound Finds a New Reason to Cheer

On Wednesday, the GBP/USD currency pair resumed its upward movement. As previously noted, the British currency currently has no valid reason to decline against the U.S. dollar—specifically, against the U.S

Paolo Greco 04:00 2025-06-12 UTC+2

Trading Recommendations and Analysis for EUR/USD on June 12: Even Inflation Didn't Please the Dollar

The EUR/USD currency pair traded very differently throughout Wednesday. During the European trading session, the pair continued its sideways movement, which had persisted for several days. There was no macroeconomic

Paolo Greco 03:55 2025-06-12 UTC+2

GBP/USD: Trading Plan for the U.S. Session on June 11th (Review of Morning Trades)

In my morning forecast, I drew attention to the 1.3483 level and planned to make trading decisions based on it. Let's look at the 5-minute chart and analyze what happened

Miroslaw Bawulski 18:41 2025-06-11 UTC+2

EUR/USD: Trading Plan for the U.S. Session on June 11th (Review of Morning Trades)

In my morning forecast, I highlighted the 1.1425 level and planned to make entry decisions based on it. Let's look at the 5-minute chart and examine what happened. The price

Miroslaw Bawulski 18:38 2025-06-11 UTC+2

How to Trade the GBP/USD Pair on June 11? Simple Tips and Trade Analysis for Beginners

Analysis of Tuesday's Trades 1H Chart of GBP/USD On Tuesday, the GBP/USD pair traded with a downward bias, which was justified by a few factors. First, the pair consolidated below

Paolo Greco 06:10 2025-06-11 UTC+2
Can't speak right now?
Ask your question in the chat.
 

Dear visitor,

Your IP address shows that you are currently located in the USA. If you are a resident of the United States, you are prohibited from using the services of InstaFintech Group including online trading, online transfers, deposit/withdrawal of funds, etc.

If you think you are seeing this message by mistake and your location is not the US, kindly proceed to the website. Otherwise, you must leave the website in order to comply with government restrictions.

Why does your IP address show your location as the USA?

  • - you are using a VPN provided by a hosting company based in the United States;
  • - your IP does not have proper WHOIS records;
  • - an error occurred in the WHOIS geolocation database.

Please confirm whether you are a US resident or not by clicking the relevant button below. If you choose the wrong option, being a US resident, you will not be able to open an account with InstaTrade anyway.

We are sorry for any inconvenience caused by this message.