empty
21.12.2023 01:12 PM
Forecast for EUR/USD on December 21, 2021

The EUR/USD pair reversed in favor of the U.S. dollar on Wednesday, consolidating below the corrective level of 61.8% (1.0960). Thus, the downward process may continue toward the next Fibonacci level of 50.0% (1.0862). I support the scenario of further decline in the pair, as, judging by the waves, the trend seems to be shifting towards the "bearish" side. However, a firm hold above the level of 1.0960 will indicate that bulls are not ready to retreat fully and may attempt to resume growth towards the level of 1.1035.

This image is no longer relevant

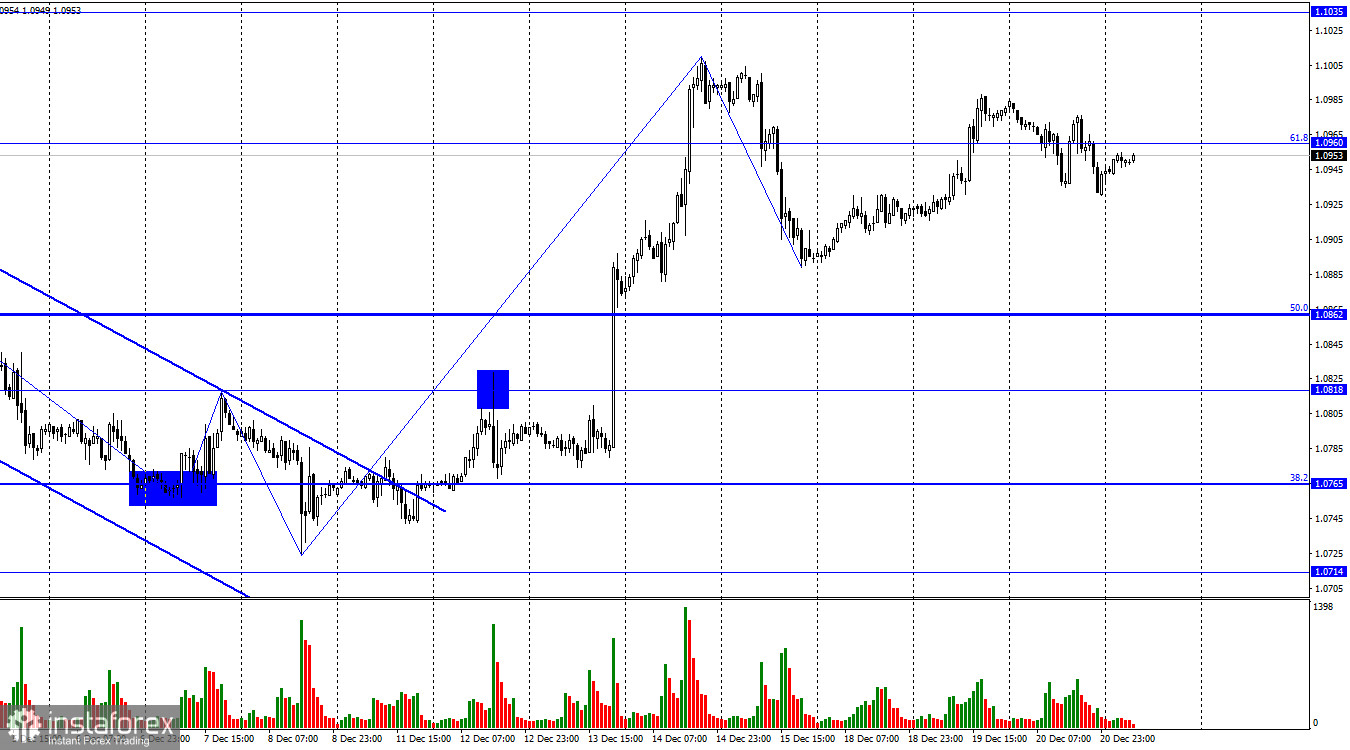
The wave situation is becoming clearer and more favorable. The last downward wave turned out to be relatively weak (compared to the previous upward wave), and the current upward wave has every chance of not surpassing the peak of the previous wave (from December 14). If this scenario unfolds, we will have the first sign of completing the "bullish" trend. In this case, a decline towards the level of 1.0862 should begin, which may only be the start of a prolonged "bearish" trend. This is the scenario I am currently counting on.

On Wednesday, there were a few interesting events in the European Union and the United States. The only U.S. report on the number of new home sales showed a value slightly higher than traders expected for November. However, this report is unimportant, and traders' reactions were practically nonexistent. Thus, this week, I can highlight only two events. The first one is the inflation report in the European Union, which showed a final decrease in November to 2.4% y/y, and the U.S. GDP report for the third quarter, which will be released today in the second half of the day.

As with European inflation, the report on economic growth in the U.S. may not cause a strong reaction. This is not the first estimate of the indicator for the third quarter, and traders are prepared to see +5.2% q/q. If today's report shows a higher or lower value, then bulls or bears will receive minor support. But overall, this week's information background is quite weak, with important reports coming only from the United Kingdom. By the end of the week, trader activity may be relatively low, but I still expect a decline in the pair toward the level of 1.0862. This target already looks quite attractive.

This image is no longer relevant

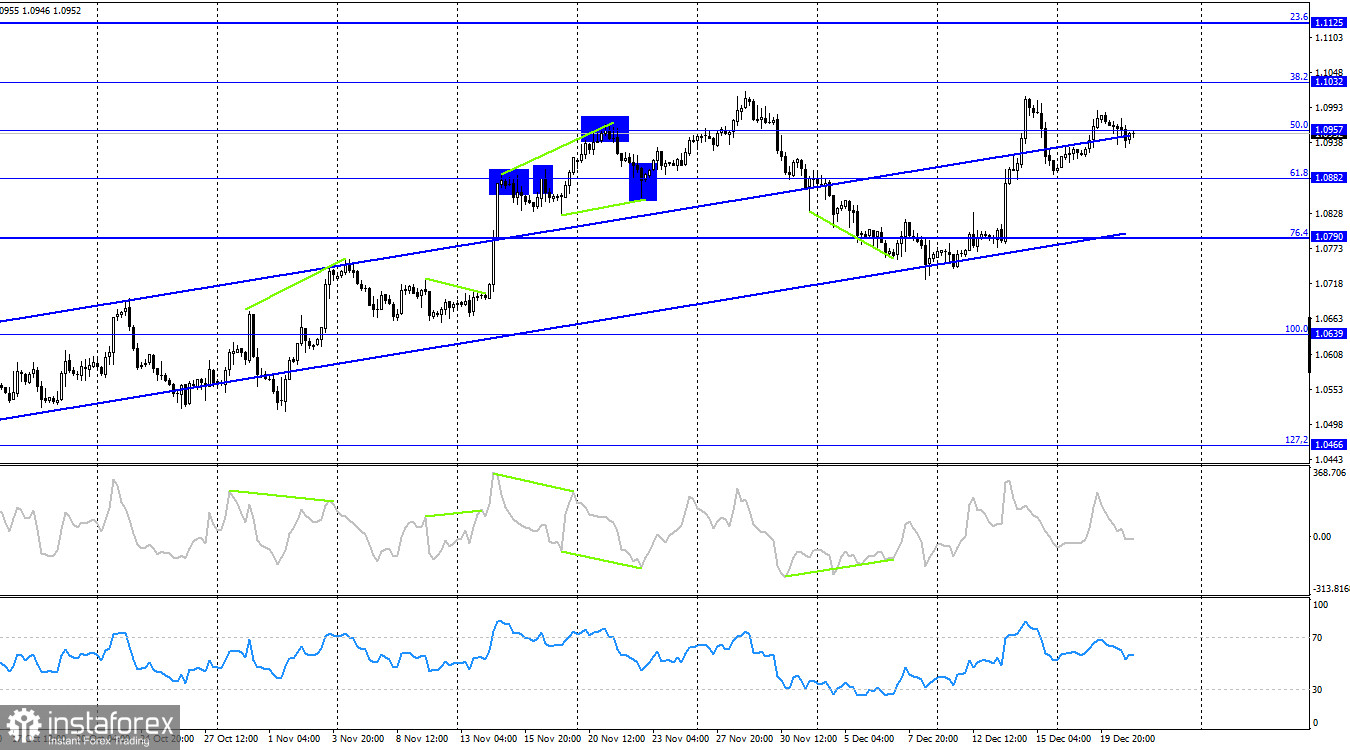
On the 4-hour chart, the pair rose to the corrective level of 50.0% (1.0957). A firm consolidation of the pair's rate above this level allows counting on further growth towards the next Fibonacci level of 38.2% at 1.1032. Reconsolidation below 1.0957 will again favor the U.S. currency and a fall to the lower line of the ascending trend corridor, which still characterizes traders' sentiment as "bullish." I expect a significant decline in the euro only after consolidating below the ascending trend corridor. Still, even under the current circumstances, a decline towards the lower line of the corridor looks promising. There are no apparent divergences with any indicator today.

Forecast for EUR/USD and trader advice:

What advice can be given to traders today? The rise of the European currency is unlikely. The continuation of the "bullish" trend is also unlikely. The information background could be stronger; the economic events calendar for the EU and the U.S. is practically empty, and traders will find it difficult to find new reasons for buying. Thus, a resumption of the decline towards the level of 1.0862 is likely. A consolidation below the level of 1.0960 can be considered for selling the pair. I consider purchases today impractical and too risky."

Samir Klishi,
Analytical expert of InstaTrade
© 2007-2025

Recommended Stories

Technical Analysis of Daily Price Movement Crude Oil Commodity Instrument, Thursday June 12, 2025.

If we look at the daily chart of the Crude Oil commodity instrument, there appears to be a Divergence between the price movement of #CL and the Stochastic Oscillator indicator

Arief Makmur 08:10 2025-06-12 UTC+2

Technical Analysis of Intraday Price Movement of Nasdaq 100 Index, Thursday June 12, 2025.

On the 4-hour chart of the Nasdaq 100 index, there is a divergence between its price movement and the Stochastic Oscillator indicator, especially with the current confirmation of the price

Arief Makmur 08:10 2025-06-12 UTC+2

Trading Signals for EUR/USD for June 12-19, 2025: sell below 1.1500 (21 SMA - 8/8 Murray)

If the euro price falls below 1.1500 in the coming hours, this could be seen as an opportunity to sell. Technically, it appears overbought on the H4 chart and could

Dimitrios Zappas 05:33 2025-06-12 UTC+2

Trading Signals for GOLD (XAU/USD) for June 12-19, 2025: sell below $3,386 (21 SMA - 7/8 Murray)

The XAU/USD trend remains bullish as long as the price consolidates above 3,331. Therefore, it would be prudent to buy gold as long as the price consolidates above 3,359, where

Dimitrios Zappas 05:32 2025-06-12 UTC+2

EUR/USD Forecast for June 12, 2025

The U.S. inflation data released on Wednesday stirred the markets: the dollar index dropped by 0.47%, WTI oil surged by 5.54%, gold rose by 1.27%, and 5-year U.S. Treasury yields

Laurie Bailey 04:40 2025-06-12 UTC+2

GBP/USD Forecast for June 12, 2025

On Wednesday, the British pound successfully avoided a decline below technical support levels, reversing upward from them. The price rebounded from the MACD indicator line on the daily chart, while

Laurie Bailey 04:40 2025-06-12 UTC+2

USD/JPY Forecast for June 12, 2025

The price correction since May 27 was complex and prolonged, posing a risk of a breakout above 146.11. However, this risk is no longer a concern with the reversal from

Laurie Bailey 04:40 2025-06-12 UTC+2

Bitcoin: Dollar Strength Could Trigger a Downturn in the Crypto Market

Today, the market's main focus will be the release of the U.S. inflation report, which is expected to show not only a halt in the recent decline but the highest

Pati Gani 11:47 2025-06-11 UTC+2

EUR/USD. June 11th. The U.S. and China Agreed on Nothing

On Tuesday, the EUR/USD pair continued to move sideways between the levels of 1.1380 and 1.1454. A new rebound from the 61.8% Fibonacci retracement level at 1.1380 enabled another rise

Samir Klishi 11:12 2025-06-11 UTC+2

GBP/USD. June 11th. UK Unemployment and US Inflation

On the hourly chart, the GBP/USD pair continued its decline on Tuesday, consolidated below the 161.8% Fibonacci level at 1.3520, and rebounded from it from below. Thus, the decline

Samir Klishi 10:56 2025-06-11 UTC+2
Can't speak right now?
Ask your question in the chat.
 

Dear visitor,

Your IP address shows that you are currently located in the USA. If you are a resident of the United States, you are prohibited from using the services of InstaFintech Group including online trading, online transfers, deposit/withdrawal of funds, etc.

If you think you are seeing this message by mistake and your location is not the US, kindly proceed to the website. Otherwise, you must leave the website in order to comply with government restrictions.

Why does your IP address show your location as the USA?

  • - you are using a VPN provided by a hosting company based in the United States;
  • - your IP does not have proper WHOIS records;
  • - an error occurred in the WHOIS geolocation database.

Please confirm whether you are a US resident or not by clicking the relevant button below. If you choose the wrong option, being a US resident, you will not be able to open an account with InstaTrade anyway.

We are sorry for any inconvenience caused by this message.