empty
28.12.2023 04:54 PM
Analysis of EUR/USD. December 28th. The euro maintains its bullish sentiment

The wave structure of the 4-hour chart for the euro/dollar pair has become more complex once again. Over the past year, we have seen only three wave structures that constantly alternate with each other. Currently, the construction of another three-wave structure, a bearish one, is continuing. The presumed wave 1 is complete, but wave 2 or b is becoming more complex for the third or fourth time. Although the news background cannot be considered "supportive of the European currency," the market keeps finding new reasons to increase demand for the pair. Such a situation is not normal. Even if the bullish trend resumes, its internal structure will be unreadable.

The internal wave structure of the presumed wave 2 or b has changed. Since the last bearish wave turned out to be disproportionately large, I now interpret it as wave b. If this is indeed the case, wave c is currently being built, and the entire wave 2 or b can still end.

The euro is overbought, but buyers are not backing down.

The euro/dollar pair decreased ten basis points on Thursday. The main decline occurred a few hours ago, but on the charts, it is evident that this is just a retracement. The bullish sentiment in the market persists, and the pair's upward movement can resume at any moment. An unsuccessful attempt to break through the 23.6% Fibonacci level pushed the quotes slightly down, but buyers continue to exert pressure, which could lead to a very rapid return of the pair to this level and its breakthrough.

There still needs to be something to say about the news background. There are no news, reports, or speeches. Notwithstanding this scenario, the market maintains its faith in the euro, the postponed commencement of the ECB's monetary policy easing program, a less substantial rate cut in 2024, optimistic expectations, and other factors contributing to its ongoing euro purchases. I believe even the news background is not needed by market participants right now. The New Year week is turning out to be not boring but rather strange. Even Eren Sengezer, one of the well-known currency analysts, acknowledges the overbought condition of the RSI indicator, forgetting that this indicator has been overbought not for the first time in recent months. Finding reasons for increased demand for the euro is becoming more and more challenging.

This image is no longer relevant

General conclusions.

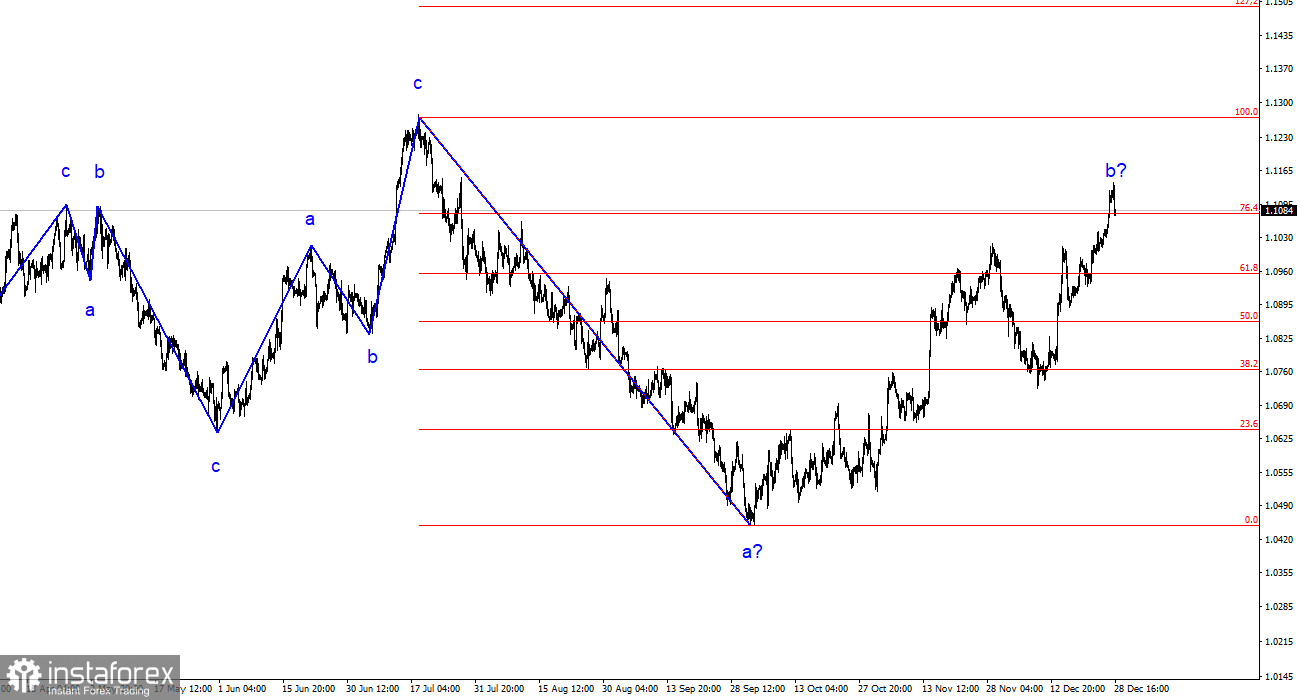
Based on the analysis conducted, the construction of a bearish wave set continues. The targets near the 1.0463 level have been ideally worked out, and the unsuccessful attempt to break this level indicates a transition to the construction of a corrective wave. Wave 2 or b has taken on a completed form, so in the near future, I expect the construction of an impulsive downward wave 3 or c with a significant decline in the pair. I still anticipate a decline with targets below the low of wave 1 or a. The unsuccessful attempt to break the 23.6% level may indicate the market's readiness for sales.

On a larger wave scale, it can be seen that the construction of corrective wave 2 or b is continuing, which in length is already more than 61.8% of Fibonacci from the first wave. As I have already mentioned, this is not critical, and the scenario of building wave 3 or c with a decline in the pair below the 1.4 figure remains in force.

Chin Zhao,
Analytical expert of InstaTrade
© 2007-2025

Recommended Stories

GBP/USD Analysis – July 14th. The Dollar Finds a New Reason to Rejoice

The wave pattern for the GBP/USD pair continues to indicate the formation of a bullish impulse wave structure. The wave picture is nearly identical to that of EUR/USD

Chin Zhao 22:23 2025-07-14 UTC+2

EUR/USD Analysis – July 14th. The Week Did Not Start on a Positive Note

The wave pattern on the 4-hour chart of the EUR/USD instrument has not changed for several months. The upward segment of the trend continues to develop, and the news background

Chin Zhao 22:19 2025-07-14 UTC+2

Weekly Forecast Using Simplified Wave Analysis for GBP/USD, AUD/USD, USD/CHF, EUR/JPY, AUD/JPY, and the US Dollar Index as of July 14th

Throughout the upcoming week, the British pound is expected to move in a generally sideways trajectory. A decline toward the support zone is likely in the first few days, followed

Isabel Clark 11:12 2025-07-14 UTC+2

Weekly Forecast Using Simplified Wave Analysis for EUR/USD, USD/JPY, GBP/JPY, USD/CAD, NZD/USD, and Gold as of July 14th

A sideways price movement is expected to continue in the upcoming week. A downward move toward the support zone is more likely in the first days, followed by a potential

Isabel Clark 10:57 2025-07-14 UTC+2

GBP/USD Analysis on July 10, 2025

The wave pattern for GBP/USD continues to indicate the formation of a bullish impulse structure. The wave picture closely resembles that of EUR/USD because the dollar remains the main driver

Chin Zhao 21:36 2025-07-10 UTC+2

EUR/USD Analysis on July 10, 2025

The wave pattern on the 4-hour EUR/USD chart has not changed for several consecutive months. The formation of the upward trend section continues, while the news background still supports

Chin Zhao 21:33 2025-07-10 UTC+2

GBP/USD Analysis on July 9, 2025

The wave pattern for GBP/USD continues to indicate the formation of an upward impulse wave pattern. The wave picture closely resembles that of EUR/USD, since the U.S. dollar remains

Chin Zhao 21:01 2025-07-09 UTC+2

EUR/USD Analysis on July 9, 2025

The wave pattern on the 4-hour chart for EUR/USD has remained unchanged for several consecutive months. The formation of the upward trend section continues, while the news background continues

Chin Zhao 20:56 2025-07-09 UTC+2

EUR/USD Analysis on July 8, 2025

The wave pattern on the 4-hour EUR/USD chart has remained consistent for several months. The upward trend segment continues to form, and the news backdrop continues to support all currencies

Chin Zhao 20:00 2025-07-08 UTC+2

GBP/USD Analysis on July 8, 2025

The wave pattern for GBP/USD continues to indicate the formation of a bullish impulse structure. The wave pattern is nearly identical to that of EUR/USD, as the U.S. dollar remains

Chin Zhao 19:46 2025-07-08 UTC+2
Can't speak right now?
Ask your question in the chat.
 

Dear visitor,

Your IP address shows that you are currently located in the USA. If you are a resident of the United States, you are prohibited from using the services of InstaFintech Group including online trading, online transfers, deposit/withdrawal of funds, etc.

If you think you are seeing this message by mistake and your location is not the US, kindly proceed to the website. Otherwise, you must leave the website in order to comply with government restrictions.

Why does your IP address show your location as the USA?

  • - you are using a VPN provided by a hosting company based in the United States;
  • - your IP does not have proper WHOIS records;
  • - an error occurred in the WHOIS geolocation database.

Please confirm whether you are a US resident or not by clicking the relevant button below. If you choose the wrong option, being a US resident, you will not be able to open an account with InstaTrade anyway.

We are sorry for any inconvenience caused by this message.