See also

 16.04.2024 03:00 AM
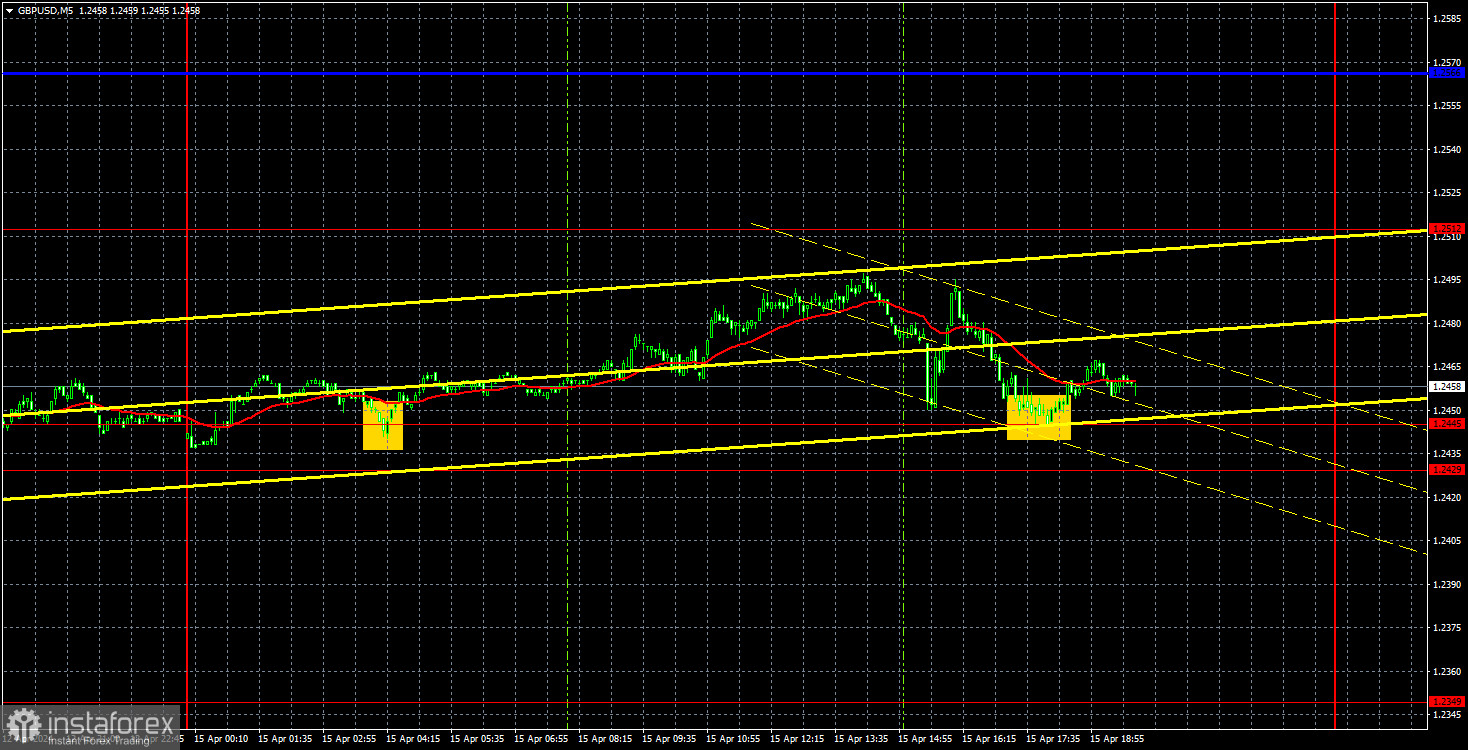
GBP/USD tried to start a bullish correction, but it was a minor movement. It seems strange for us to talk about the pound finding it difficult to show growth. Over the past 6-8 months, the British pound has been rising left and right. However, the 4-month flat has finally ended, and now the pair is particularly heading downwards. On Monday, the US released a retail sales report, which significantly exceeded expectations. This was another US report that turned out to be stronger than the market expected, demonstrating the strength of the American economy, despite the high rates of the Federal Reserve.
The pair has not yet managed to break through the 1.2429-1.2445 range, but it seems to be only a matter of time. So far, the market has only taken the first step towards a new downtrend, which by all estimates should be strong and long-lasting. The pound has just settled below the 1.2516 level, which can be considered the boundary of the sideways channel on the 24-hour timeframe. It is important that the market does not receive any factors that can support the British currency in the near future, as bulls could quickly return to the market and disrupt the entire technical picture with their groundless purchases.
This week, there are events that could support both the dollar and the pound. The key event is the UK inflation report. The stronger the decline in inflation by the end of March, the higher the likelihood of seeing a new, predictable decline in the British currency. British inflation may "overtake" US inflation, and the Bank of England could surpass the Fed in starting the rate cut cycle.
Two trading signals were formed on Monday. In both cases, the price bounced off the 1.2445 level. The first buy signal was formed overnight, but at the opening of the European trading session, the price remained near the point where a signal is formed. Therefore, traders could open a long position. The price did not reach the target level of 1.2512, and during the US trading session, the pair returned to the 1.2445 level. The second buy signal was formed too late in time for traders to act on it. The first trade closed at breakeven with a Stop Loss.
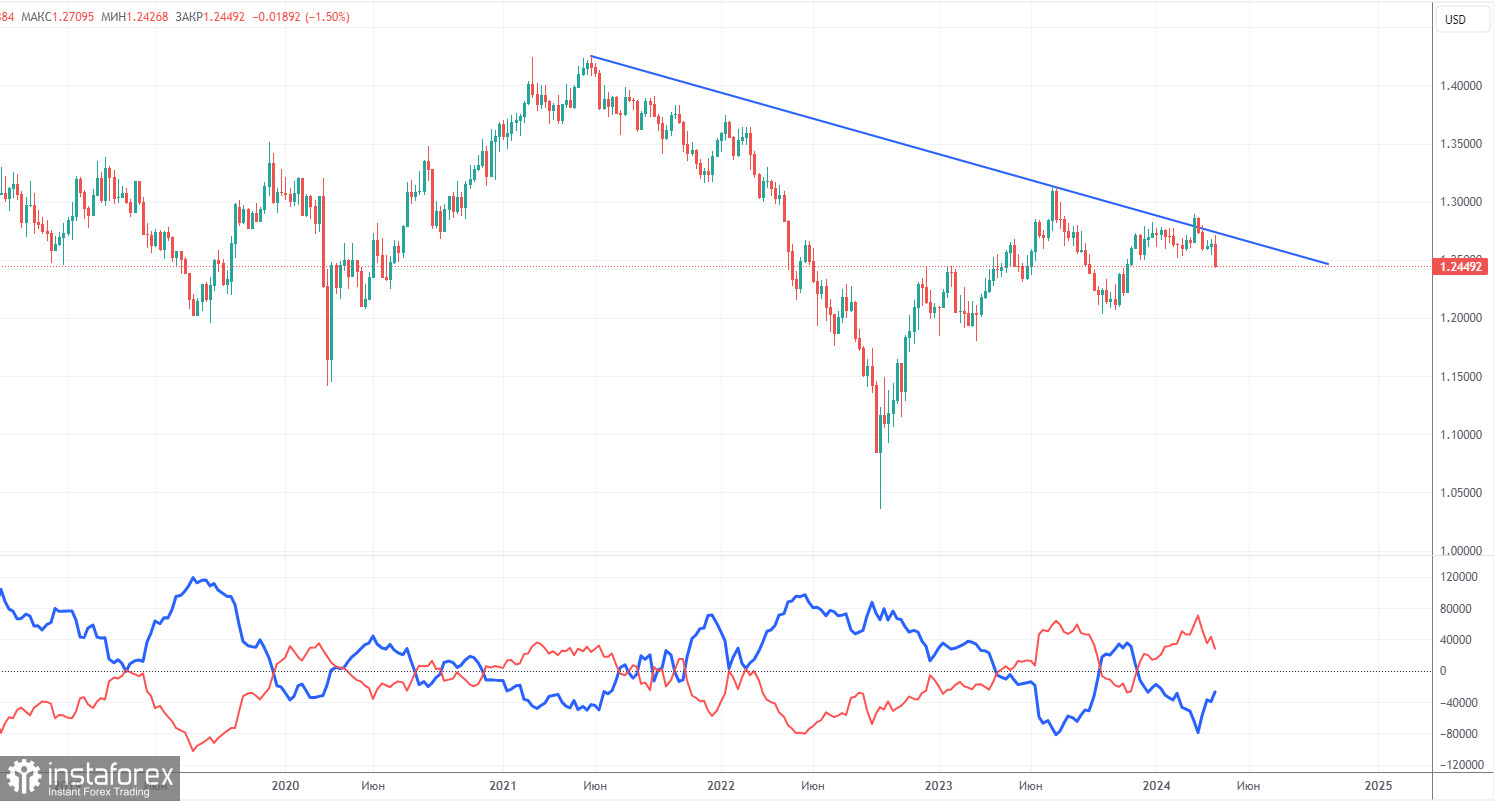
COT reports on the British pound show that the sentiment of commercial traders has frequently changed in recent months. The red and blue lines, which represent the net positions of commercial and non-commercial traders, constantly intersect and, in most cases, remain close to the zero mark. According to the latest report on the British pound, the non-commercial group closed 18,400 buy contracts and 3,200 short ones. As a result, the net position of non-commercial traders decreased by 15,200 contracts in a week. The fundamental background still does not provide a basis for long-term purchases of the pound sterling, and the currency finally has a real chance to end the flat period. The trend line on the 24-hour TF clearly indicates what trend we are currently in.
The non-commercial group currently has a total of 80,000 buy contracts and 51,700 sell contracts. The bulls no longer have a significant advantage. Therefore, the pound has a huge potential to fall. We can only hope that inflation in the UK will not start to accelerate, or that the Bank of England will not intervene.
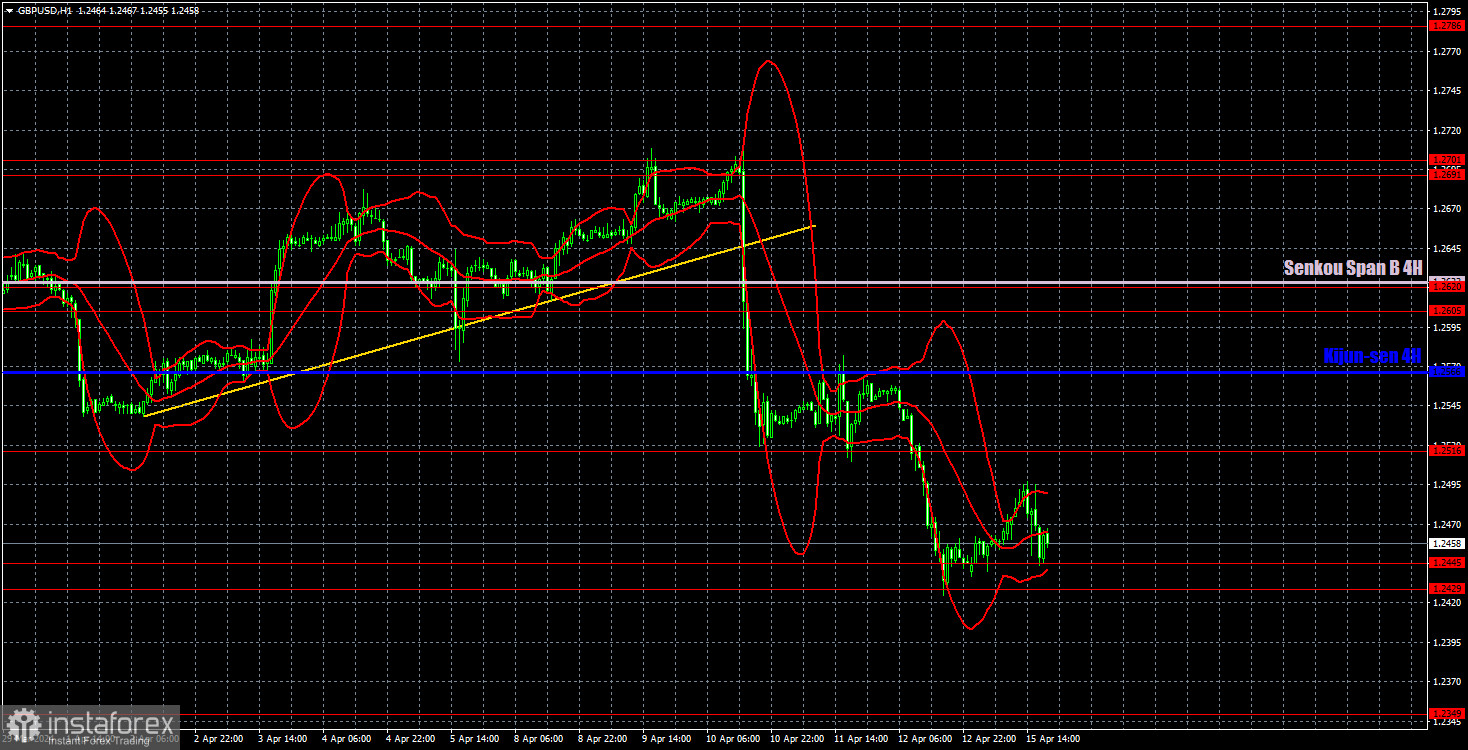
On the 1H chart, GBP/USD has left the sideways channel of 1.25-1.28. Now, a downtrend may resume, and the pair has the potential to fall by at least 400-500 pips. The fundamental and macroeconomic background continues to support the dollar, as the US economy is much stronger than the British one, and the Federal Reserve keeps pushing back the first rate cut to a later date. As a result, even the Bank of England may lower its key rate sooner.
As of April 16, we highlight the following important levels: 1.2215, 1.2269, 1.2349, 1.2429-1.2445, 1.2516, 1.2605-1.2620, 1.2691-1.2701, 1.2786, 1.2863, 1.2981-1.2987. The Senkou Span B (1.2622) and Kijun-sen (1.2566) lines can also serve as sources of signals. Don't forget to set a Stop Loss to breakeven if the price has moved in the intended direction by 20 pips. The Ichimoku indicator lines may move during the day, so this should be taken into account when determining trading signals.
On Tuesday, the UK will release reports on unemployment, wages, and unemployment claims. These data may provoke a market reaction but are unlikely to significantly affect market sentiment. In the US, only secondary reports will be released, which may not even trigger a local reaction.
Support and resistance levels are thick red lines near which the trend may end. They do not provide trading signals;
The Kijun-sen and Senkou Span B lines are the lines of the Ichimoku indicator, plotted to the 1H timeframe from the 4H one. They provide trading signals;
Extreme levels are thin red lines from which the price bounced earlier. They provide trading signals;
Yellow lines are trend lines, trend channels, and any other technical patterns;
Indicator 1 on the COT charts is the net position size for each category of traders;
You have already liked this post today
*The market analysis posted here is meant to increase your awareness, but not to give instructions to make a trade.


