See also

 18.04.2024 05:28 PM
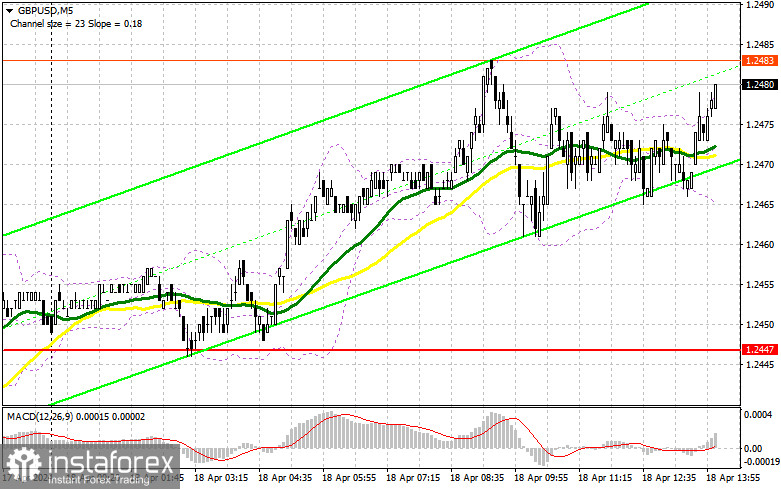
In my morning forecast, I pointed out the level of 1.2447 and planned to make trading decisions based on it. Let's look at the 5-minute chart and analyze what happened there. The pair's decline occurred, but the update of 1.2447 did not happen. Low market volatility and the absence of important statistics from the UK led to a decrease in trading volume. The technical picture remained unchanged for the second half of the day.
To open long positions on GBP/USD:
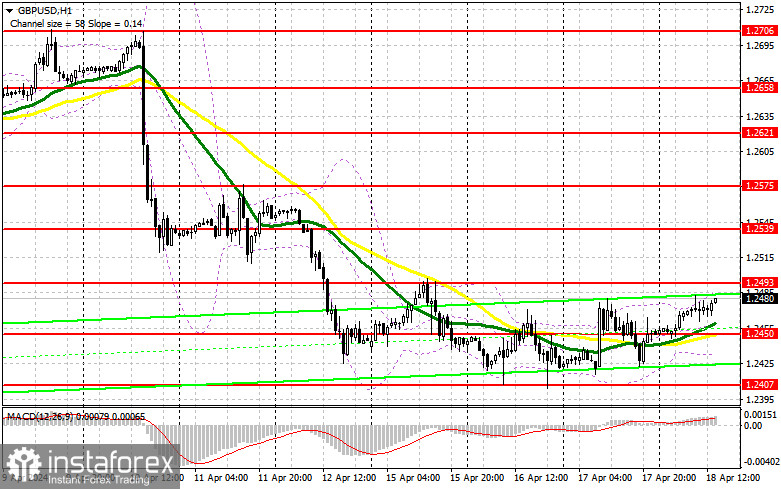
Now, let's see how traders will behave after a series of fundamental statistics from the US, which show that they can stir up the market. Figures on initial jobless claims, the Federal Reserve Bank of Philadelphia's manufacturing index, existing home sales volume, and the leading indicators index are expected. These are secondary reports, but something may happen in the current market conditions of complete calm. In case of a pair's decline, buyers will need to prove their presence in the market, and the formation of a false breakout around 1.2450 will help with this, providing an entry point for buying with a target of growth to the resistance at 1.2493, which we didn't reach in the first half of the day. Breaking and testing this range from top to bottom will strengthen the chance of a GBP/USD recovery, leading to new purchases and allowing it to reach 1.2539. If the pair breaks above this range, we can talk about a surge towards 1.2575, where I plan to take a profit. In the scenario of a decline in GBP/USD and the absence of buyers at 1.2450 in the second half of the day, sellers will get a chance for a larger pair's decline along the trend. In this case, I will look for purchases around 1.2407. Forming a false breakout will be a suitable option for entering the market. Opening long positions on GBP/USD immediately on a rebound can be done from 1.2375 with a 30-35 point correction target within the day.
To open short positions on GBP/USD:
The chances of the pound's decline remain. But before that, I would like to see how sellers will behave around the nearest resistance at 1.2493, where a false breakout will provide a suitable entry point for selling in an attempt to push through the fairly significant support at 1.2450, which acts as the middle of a sideways channel, and where the moving averages are located, playing on the bulls' side. Breaking and retesting from the bottom to the top of 1.2450 will increase pressure on the pair, giving bears an advantage and another entry point for selling with targets of renewing 1.2407 and 1.2375. The ultimate target will be around 1.2340, where I will make a profit. In the scenario of GBP/USD growth and the absence of bears at 1.2493 in the second half of the day, bulls will have the opportunity to build up a fairly good correction toward the resistance at 1.2359. I will also consider selling there only on a false breakout. If there is no activity, I advise opening short positions on GBP/USD from 1.2575, counting on a pair's rebound downwards by 30-35 points within the day.
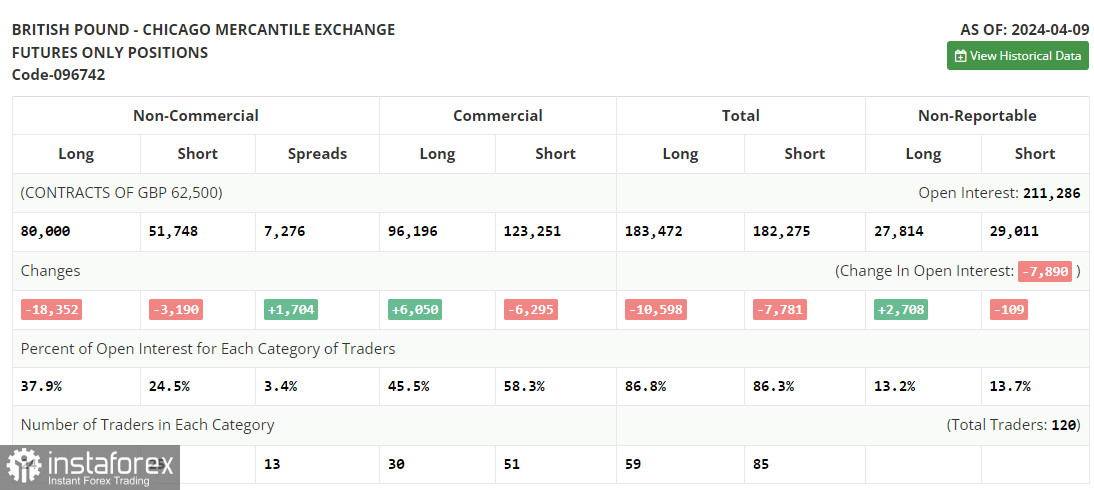
The COT report (Commitment of Traders) for April 9th showed a sharp decrease in long and short positions. Pound buyers left the market faster than sellers, and there are objective reasons for this: the main one is the high inflationary pressure in the US, which will maintain demand for the dollar, exerting serious pressure on risky assets, including the British pound. The second reason is the soft policy of the Bank of England, which has yet to go anywhere. New statements from the regulator's representatives may negatively affect the bullish prospects for the pound, especially after the ECB's clear position last week, which consisted of rate cuts in the eurozone as early as this summer. In addition to all this, the Federal Reserve needs to maintain a tough stance, and it is unlikely that we can expect a strong bullish market in the GBP/USD pair. The latest COT report states that long non-commercial positions decreased by 18,352 to 80,000, while short non-commercial positions decreased by 3,190 to 51,748. As a result, the spread between long and short positions increased by 1,704.
Indicator signals:
Moving averages
Trading is above the 30 and 50-day moving averages, indicating pound growth.
Note. The period and prices of moving averages considered by the author are on the hourly chart H1 and differ from the general definition of classic daily moving averages on the daily chart D1.
Bollinger Bands
In case of a decline, the lower boundary of the indicator, around 1.2440, will act as support.
Indicator descriptions:
You have already liked this post today
*The market analysis posted here is meant to increase your awareness, but not to give instructions to make a trade.


