See also

 19.04.2024 04:18 PM
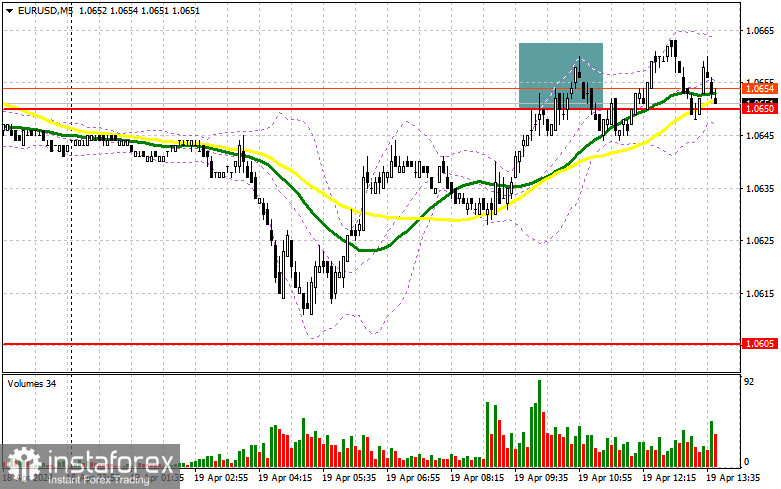
In my morning forecast, I paid attention to the 1.0650 level and planned to decide to enter the market from it. Let's look at the 5-minute chart and figure out what happened there. The growth and formation of a false breakdown in the area of 1.0686 led to a sell signal, which was never fully realized. After moving down by 5 points, the pair returned to 1.0650, where trading is currently underway. In the afternoon, the technical picture changed only slightly.
To open long positions on EUR/USD, you need:
The lack of important statistics on the eurozone allowed the euro to recover some losses observed during the Asian session. However, as expected, the movement failed to develop into a major uptrend. Given that we don't have any US statistics ahead, trading will likely continue around the 1.0650 level with low volume and low volatility. I will act in case the pair drops to the area of 1.0645. In forming a false breakout, there will be a suitable option for purchases in the expectation of another attempt to grow to 1.0688, which could not be done in the first half of the day. A breakout and a top-down update of this range will strengthen the pair with a chance of a breakthrough to 1.0726. The farthest target will be a maximum of 1.0754, where I will record profits. With the option of a decrease in EUR/USD and a lack of activity in the area of 1.0645, where the moving averages playing on the buyers' side are slightly higher, the pressure on the euro will return within the bearish trend. In this case, I will enter the market only after the formation of a false breakdown in the area of the next support of 1.0605. I will open long positions immediately for a rebound from 1.0569 with the aim of an upward correction of 30-35 points within the day.
To open short positions on EUR/USD, you need:
Even despite the correction of the pair, euro sellers have every chance of further decline. To do this, it would be nice for them to regain control of 1.0645, but the formation of a false breakdown in the resistance area of 1.0688 is also suitable, which would be an ideal scenario for entering short positions with the prospect of updating the support of 1.0645. A breakout and consolidation below this range and a reverse bottom-up test will give another selling point with the pair moving to the 1.0605 area, which will return the bearish trend. I expect a more active manifestation of large buyers there. The farthest target will be a minimum of 1.0569, where I will record profits. In case of an upward movement of EUR/USD in the afternoon and the absence of bears at 1.0688, the bulls will try to continue the correction. In such a case, I will postpone sales until testing the next resistance at 1.0726. I will also sell there, but only after an unsuccessful consolidation. I plan to open short positions immediately on a rebound from 1.0754 with a 30-35 point downward correction target.
Indicator signals:
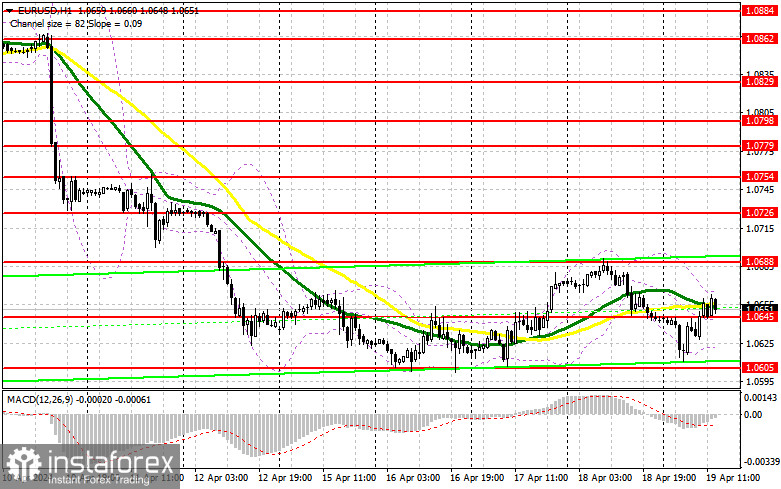
Moving averages
Trading is around the 30 and 50-day moving averages, indicating a sideways market.
Note: The author considers the period and prices of moving averages on the hourly chart H1, which differs from the general definition of classic daily moving averages on the daily chart D1.
Bollinger Bands
In case of a decline, the lower boundary of the indicator, around 1.0620, will act as support.
Description of indicators:
• Moving average (MA): Determines the current trend by smoothing volatility and noise. Period 50. Marked in yellow on the chart.
• Moving average (MA): Determines the current trend by smoothing volatility and noise. Period 30. Marked in green on the chart.
• MACD (Moving Average Convergence/Divergence): Fast EMA period 12, Slow EMA period 26, SMA period 9.
• Bollinger Bands: Period 20.
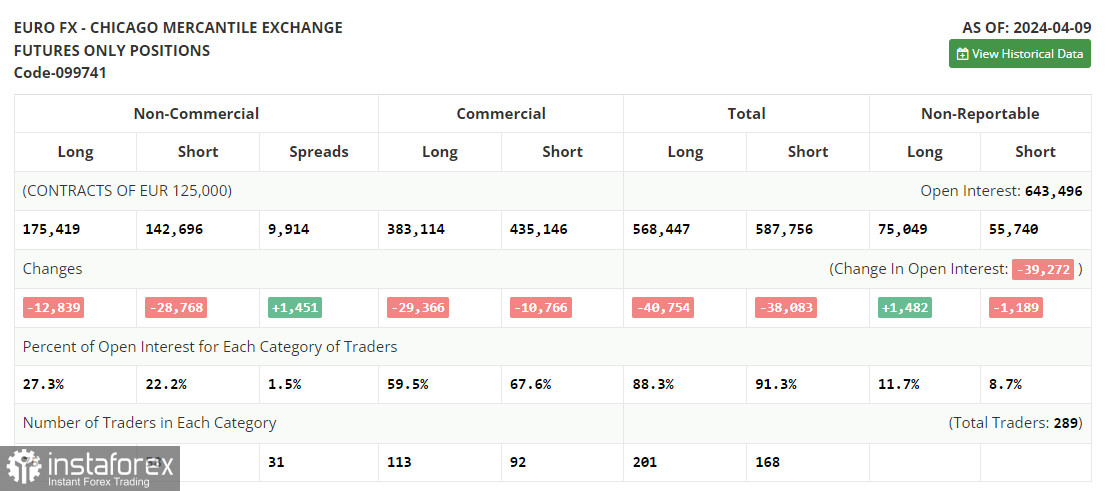
• Non-commercial traders - speculators such as individual traders, hedge funds, and large institutions using the futures market for speculative purposes and meeting certain requirements.
• Long non-commercial positions represent the total long open position of non-commercial traders.
• Short non-commercial positions represent the total short open position of non-commercial traders.
• The net non-commercial position is the difference between non-commercial traders' short and long positions.
You have already liked this post today
*The market analysis posted here is meant to increase your awareness, but not to give instructions to make a trade.


