See also

 23.04.2024 05:12 AM
EUR/USD
Yesterday, the euro held the candle body in the range of 1.0636/56, and even closed the day slightly lower. However, the Marlin oscillator continued to rise on the daily chart, pulling the price towards leaving the range, presumably towards the level of 1.0696. Overcoming this resistance will allow the price to correct higher towards the target level of 1.0724, which is the April 2 low.
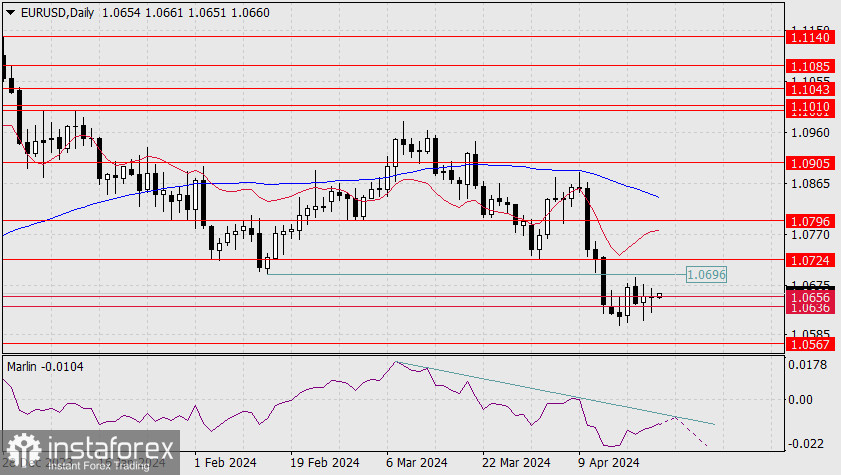
But the signal line of the oscillator faces resistance, and it may turn downwards. If this happens, the euro will not rise above the intermediate level of 1.0696. On the 4-hour chart, the price moves above the upper boundary of the range at 1.0656 and will soon encounter resistance from the MACD indicator line (1.0671), which coincides with yesterday's high.
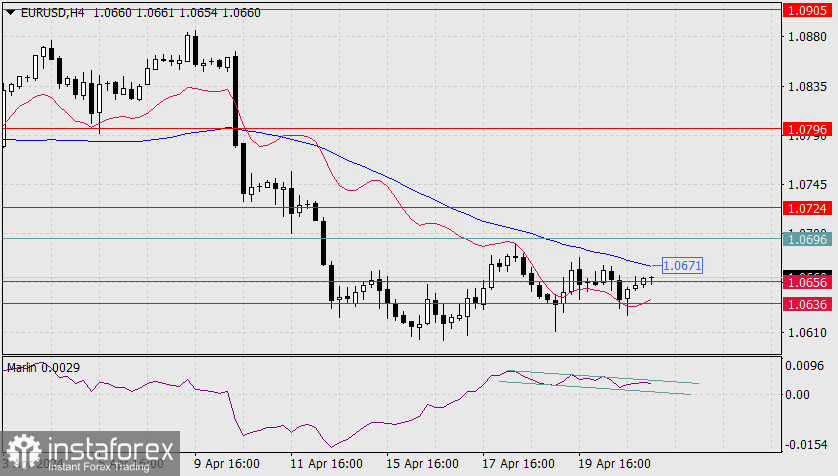
This is the first resistance as the price makes its way towards 1.0696. The Marlin oscillator is moving down, almost horizontally, in a narrow channel. After such a pattern, the price is expected to move upwards. We're waiting for the correction to end.
You have already liked this post today
*The market analysis posted here is meant to increase your awareness, but not to give instructions to make a trade.


