See also

 23.04.2024 07:26 AM
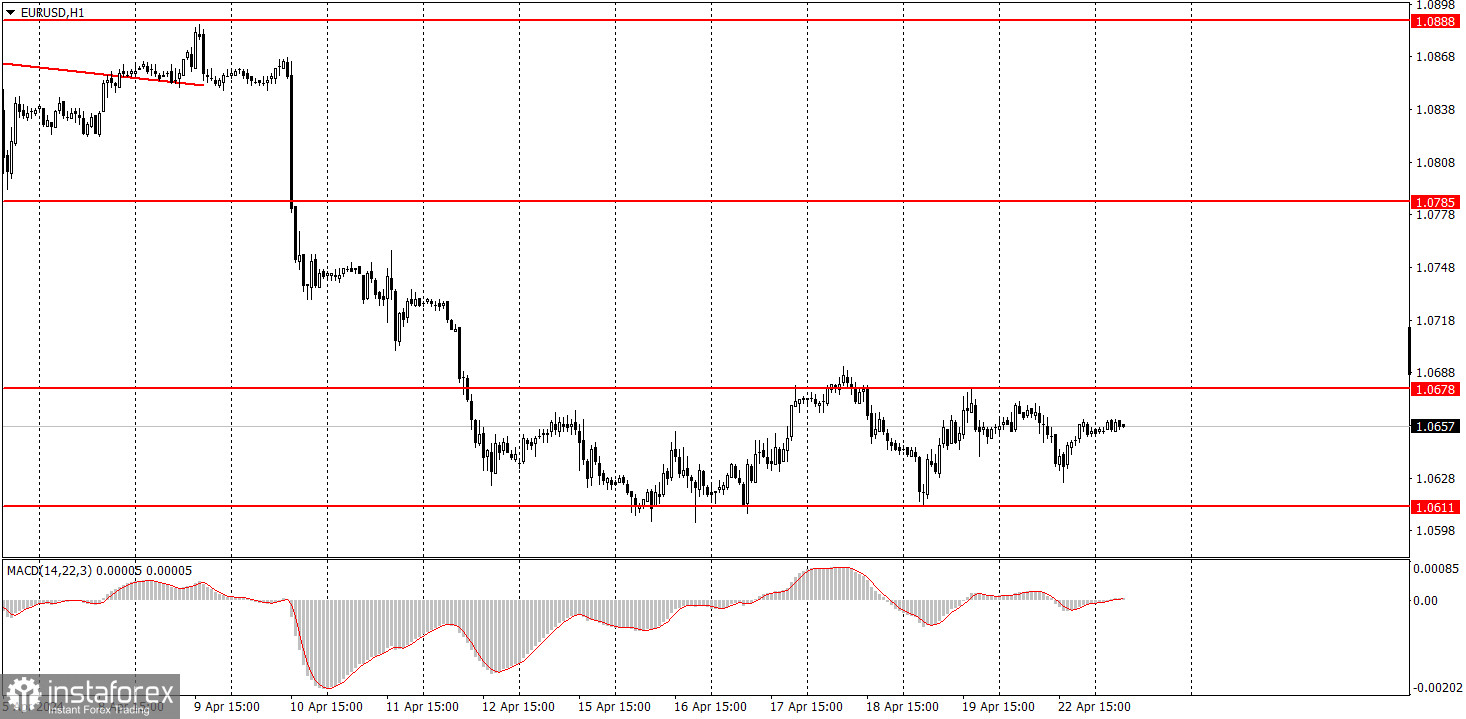
A significant number of macroeconomic events are scheduled for Tuesday. The UK, the US, and the wider Eurozone area will see updates to Purchasing Managers Index (PMI) figures. These indices are more important for the European countries, as the US releases its own ISM indices, which the market values more than the standard S&P indices for the US. Therefore, today's European PMI data can influence market sentiment in the morning.
However, it is important to remember that business activity indices are not the most important indicators of economic health. The market may show a minor reaction in the absence of significant deviations from forecasted values.
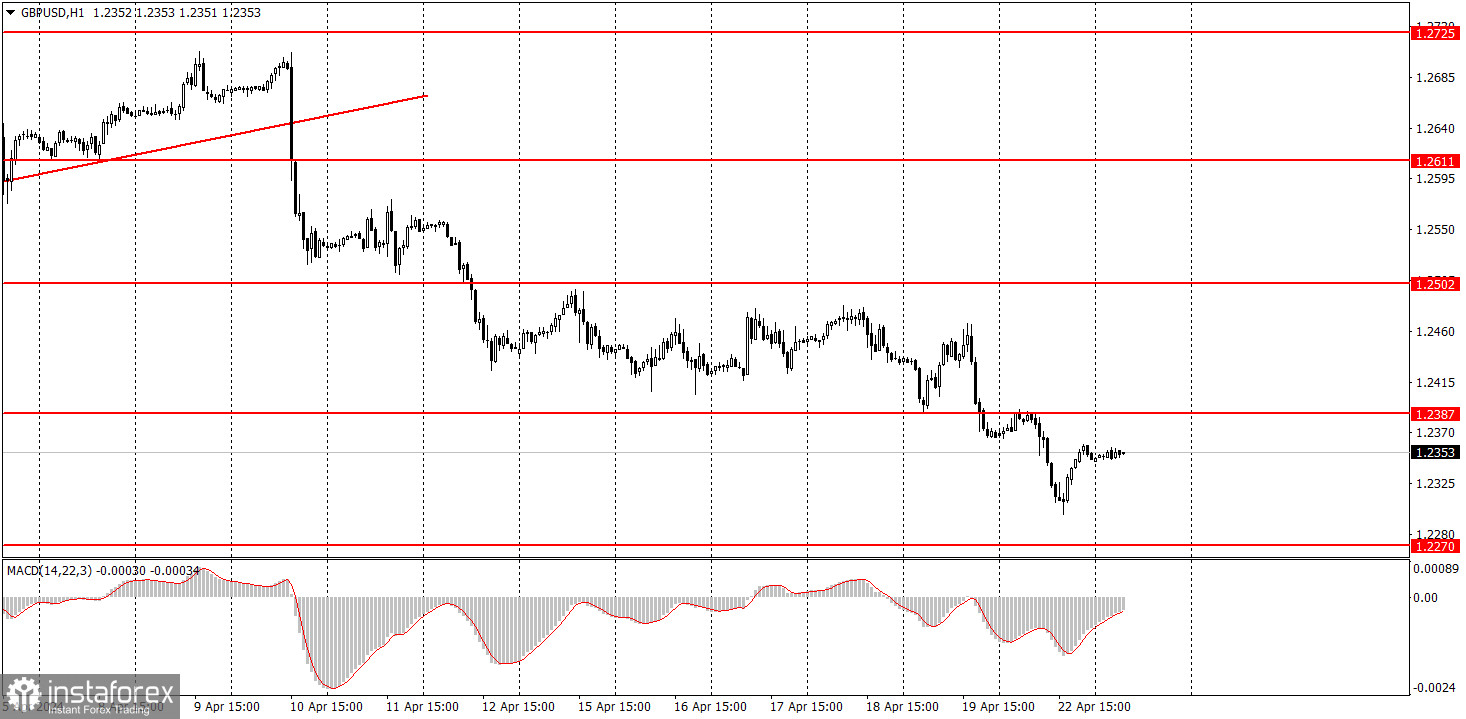
From Tuesday's fundamental events, only a speech by Huw Pill from the Bank of England stands out. The BoE typically faces more questions than the European Central Bank or the Federal Reserve, so Pill may share information that traders are not yet aware of. However, we should not expect an immediate market reaction to Pill's statements. Speeches by central bank officials typically have a background effect on market sentiment. The British pound should continue to decline regardless. Meanwhile, the euro is currently in a sideways channel, and it will be difficult to break out of this area today.
Today, novice traders should pay attention to the PMI data. The values of these reports may coincide or almost coincide with the forecasts. In this case, one should not expect a market reaction.
1) Signal strength is determined by the time taken for its formation (either a bounce or level breach). A shorter formation time indicates a stronger signal.
2) If two or more trades around a certain level are initiated based on false signals, subsequent signals from that level should be disregarded.
3) In a flat market, any currency pair can produce multiple false signals or none at all. In any case, the flat trend is not the best condition for trading.
4) Trading activities are confined between the onset of the European session and mid-way through the U.S. session, after which all open trades should be manually closed.
5) On the 30-minute timeframe, trades based on MACD signals are only advisable amidst substantial volatility and an established trend, confirmed either by a trendline or trend channel.
6) If two levels lie closely together (ranging from 5 to 15 pips apart), they should be considered as a support or resistance zone.
Support and Resistance price levels can serve as targets when buying or selling. You can place Take Profit levels near them.
Red lines represent channels or trend lines, depicting the current market trend and indicating the preferable trading direction.
The MACD(14,22,3) indicator, encompassing both the histogram and signal line, acts as an auxiliary tool and can also be used as a signal source.
Significant speeches and reports (always noted in the news calendar) can profoundly influence the price dynamics. Hence, trading during their release calls for heightened caution. It may be reasonable to exit the market to prevent abrupt price reversals against the prevailing trend.
Beginners should always remember that not every trade will yield profit. Establishing a clear strategy coupled with sound money management is the cornerstone of sustained trading success.
You have already liked this post today
*The market analysis posted here is meant to increase your awareness, but not to give instructions to make a trade.


