See also

 05.06.2024 03:39 AM
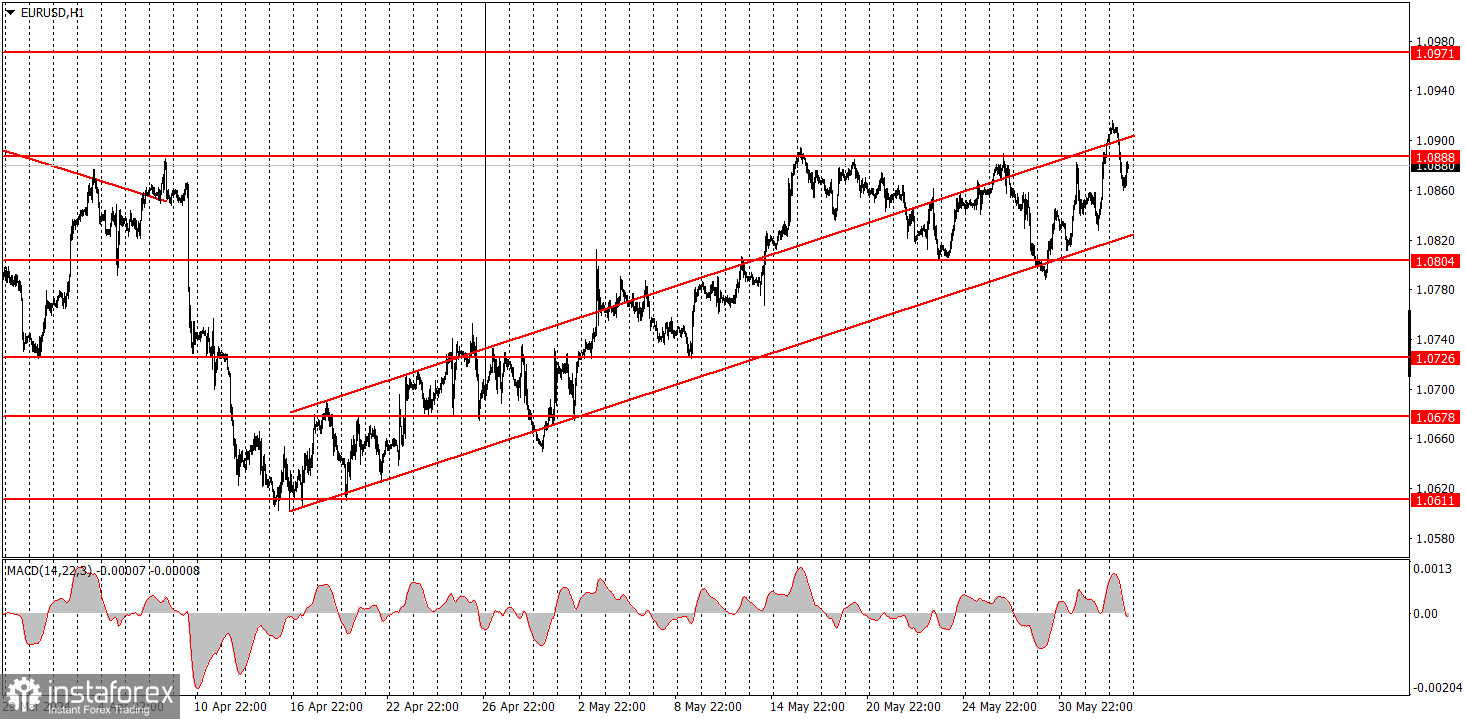
The upward trend remained intact on Tuesday. We've intentionally reduced the scale of the hourly timeframe to show the entire movement that started over a month and a half ago. The main point is that EUR/USD settled below the ascending channel twice, and both times we didn't even see the pair fall. It is steadily moving up but frequently retreats. Impulsive upward jumps are quite small, as are the subsequent pullbacks. The pair moves in different directions, but this happens while volatility is low. Therefore, beginners should clearly understand the type of movement they are dealing with at the moment.
From a fundamental perspective, the pair still has no reason to rise since the European Central Bank is expected to lower the key rate on Thursday. The macroeconomic background supports the upward movement, since the US has shown disappointing reports for two months. Nevertheless, we do not believe that macroeconomics is more important than fundamentals.
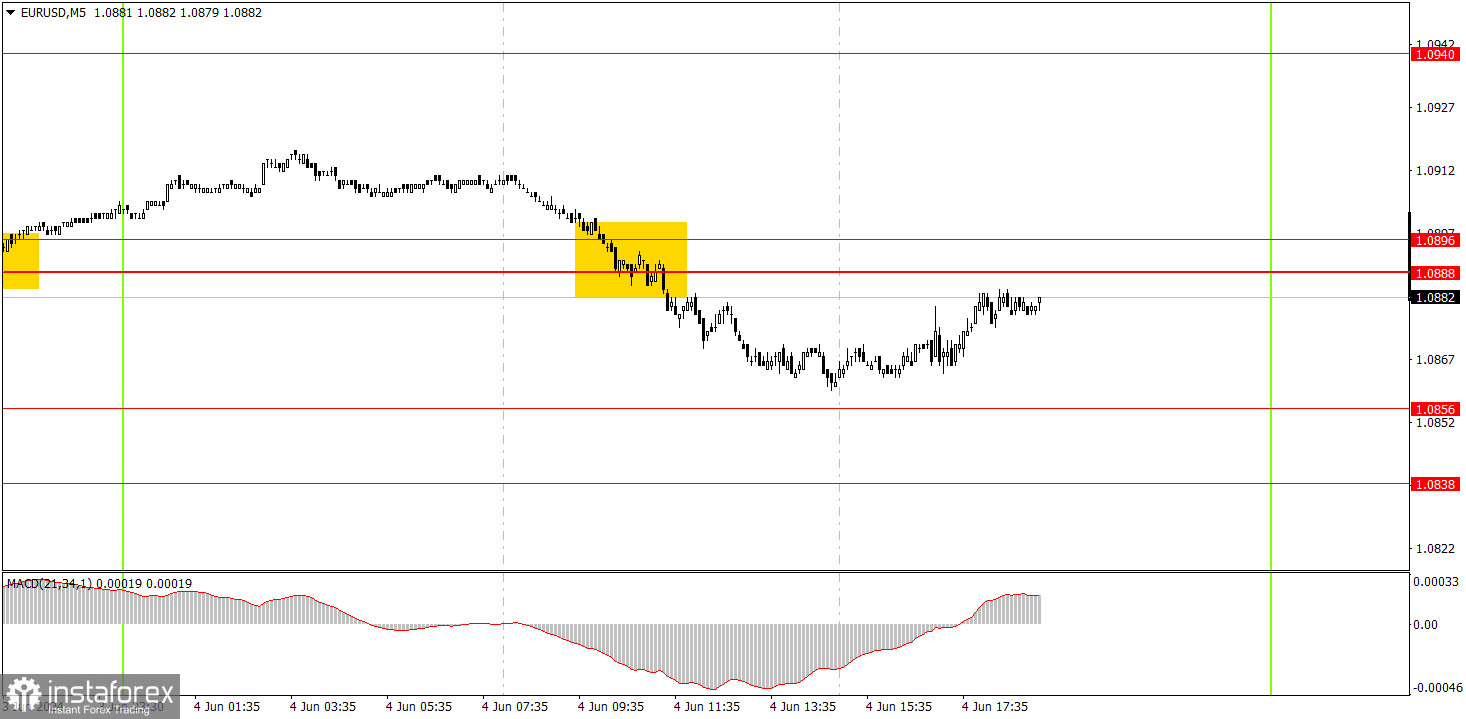
One trading signal was formed on the 5-minute timeframe. During the European session, the price settled below the 1.0888-1.0896 area, after which it managed to fall by about 18 pips, which was enough to set a Stop Loss to breakeven but not more. Beginners could have closed the trade with a profit during the US session when the US released another report (JOLTs), which had a lower value than expected. Therefore, traders could make a small profit yesterday.
On the hourly chart, the bullish correction remains intact. We still believe that the euro should decline in the medium term, as the overall trend remains downward. However, the market refuses to buy the dollar for unknown reasons and the price can't even break out of the ascending channel. A new downward trend may form if the price consolidates below the ascending channel.
On Wednesday, beginners can expect the pair to rise, as the US will publish reports on the labor market and business activity. There is a high probability that these reports will be weak, which will provoke a new fall in the dollar. Otherwise, the dollar may strengthen a bit further.
The key levels on the 5M chart are 1.0483, 1.0526, 1.0568, 1.0611, 1.0678, 1.0726-1.0733, 1.0797-1.0804, 1.0838-1.0856, 1.0888-1.0896, 1.0940, 1.0971-1.0981. Today, secondary data on the services PMI for May and the producer price index will be published in the Eurozone. The US docket will feature crucial reports on the ISM services index and the ADP's nonfarm employment change.
1) Signal strength is determined by the time taken for its formation (either a bounce or level breach). A shorter formation time indicates a stronger signal.
2) If two or more trades around a certain level are initiated based on false signals, subsequent signals from that level should be disregarded.
3) In a flat market, any currency pair can produce multiple false signals or none at all. In any case, the flat trend is not the best condition for trading.
4) Trading activities are confined between the onset of the European session and mid-way through the U.S. session, after which all open trades should be manually closed.
5) On the 30-minute timeframe, trades based on MACD signals are only advisable amidst substantial volatility and an established trend, confirmed either by a trendline or trend channel.
6) If two levels lie closely together (ranging from 5 to 15 pips apart), they should be considered as a support or resistance zone.
Support and Resistance price levels can serve as targets when buying or selling. You can place Take Profit levels near them.
Red lines represent channels or trend lines, depicting the current market trend and indicating the preferable trading direction.
The MACD(14,22,3) indicator, encompassing both the histogram and signal line, acts as an auxiliary tool and can also be used as a signal source.
Significant speeches and reports (always noted in the news calendar) can profoundly influence the price dynamics. Hence, trading during their release calls for heightened caution. It may be reasonable to exit the market to prevent abrupt price reversals against the prevailing trend.
Beginners should always remember that not every trade will yield profit. Establishing a clear strategy coupled with sound money management is the cornerstone of sustained trading success.


