empty
06.09.2024 02:31 PM
EUR/USD: Trading Plan for the U.S. session on September 6 (Review of morning trades). The euro has been put on pause

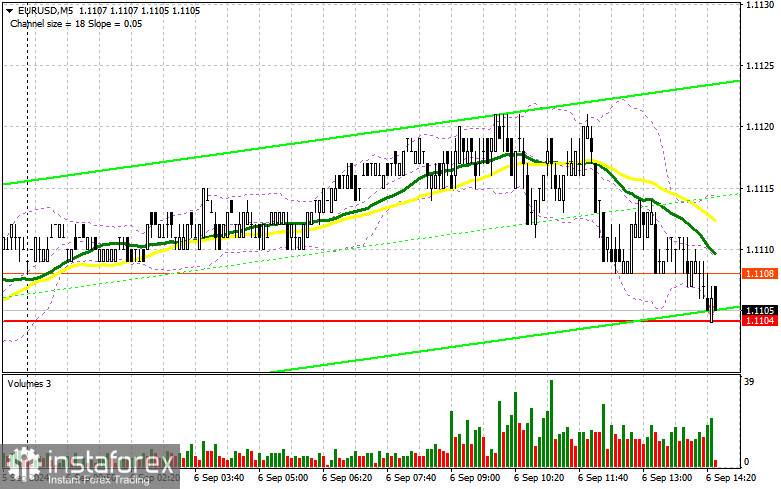
In my morning forecast, I highlighted the 1.1104 level and planned to make trading decisions based on it. Let's look at the 5-minute chart and analyze what happened. The price fell to the 1.1104 level, but no entry points were formed, so I didn't make any trades. The technical picture hasn't been revised for the second half of the day.

This image is no longer relevant

To open long positions on EUR/USD:

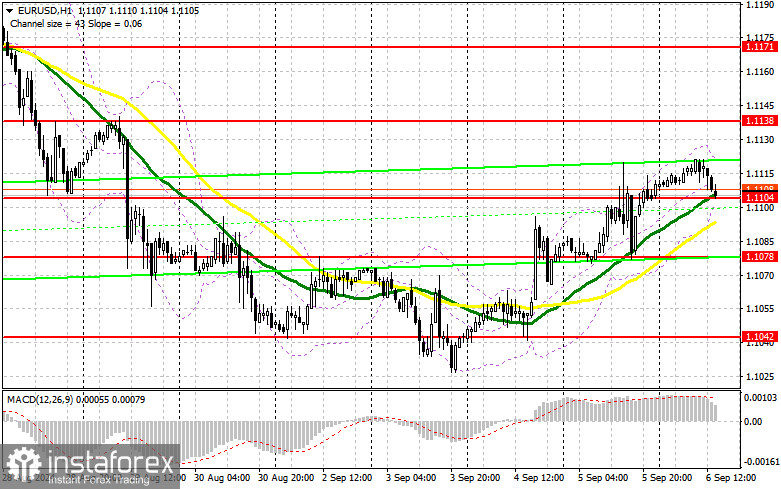
Everyone is waiting for U.S. statistics, so let's focus on them. If the unemployment rate rises and the number of non-farm jobs in the U.S. increases by 150,000 or less, pressure on the dollar is likely to increase, leading to a sharp strengthening of the euro as the upward trend continues. This scenario would increase the chances of the Federal Reserve cutting rates by 0.5%. The speeches of FOMC members John Williams and Christopher Waller would play an important role in this scenario. If the U.S. unemployment rate decreases, the dollar will likely strengthen, and the EUR/USD pair will return to the weekly low area. In that case, I will consider buying only around the new support level of 1.1078, which formed following yesterday's session. A false breakout at the 1.1078 level would provide an entry point for long positions, aiming to retest the 1.1104 level, where the pair is currently trading. A breakout and update from above to below this range would lead to further growth for the pair, with a chance to test the 1.1138 level. The final target would be the 1.1171 high, where I will take profits. In the case of a decline in EUR/USD and low activity around 1.1078 in the second half of the day, sellers will regain control, leading to a larger correction for the pair. In that case, I will enter only after forming a false breakout around the next support at 1.1042. I plan to open long positions immediately on a rebound from 1.1012, targeting a 30–35 point upward correction within the day.

To open short positions on EUR/USD:

Sellers are currently staying on the sidelines, and this approach will likely continue until the statistics are released. If the reaction to the data is positive, only a false breakout around 1.1138 would provide a suitable condition for opening short positions, with the goal of retesting the new support at 1.1104. A breakout and consolidation below this range, followed by a reverse test from below, will offer another opportunity to sell, targeting the 1.1078 level. The final target will be 1.1042, where I will take profits. If EUR/USD rises and bears are absent at 1.1138, buyers will strengthen their advantage. This will provide a chance to test the 1.1171 resistance. I will also sell there, but only after a failed consolidation. I plan to open short positions immediately on a rebound from 1.1199, targeting a 30–35 point downward correction.

This image is no longer relevant

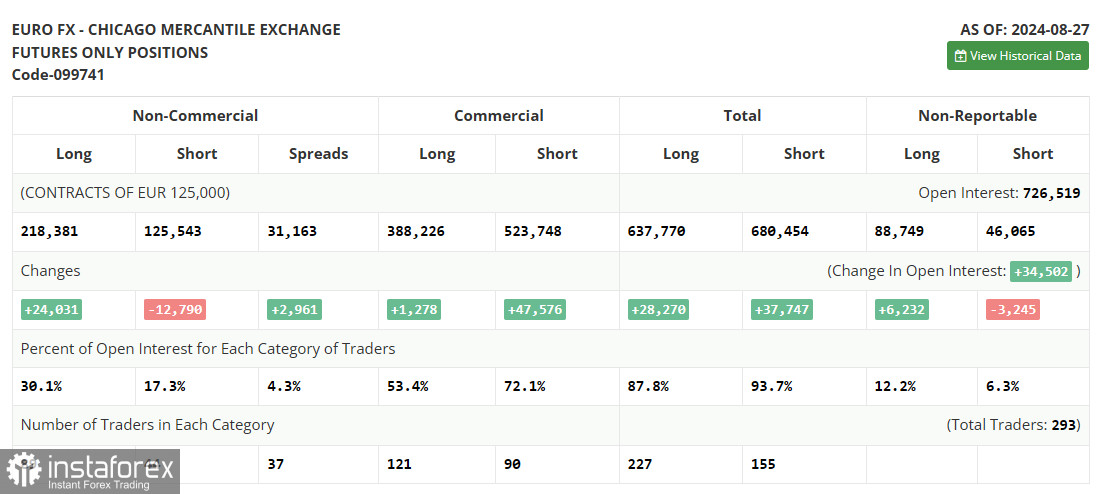
The COT report (Commitment of Traders) for August 27 showed a rise in long positions and a significant reduction in short positions. This indicates a continued bullish sentiment among buyers of risky assets, which intensified after Federal Reserve Chairman Jerome Powell's speech at Jackson Hole, clearly signaling that US rates will be cut in September. The current report reflects the market's full reaction to these statements. The dollar's future direction will largely depend on labor market and inflation data, so I recommend paying close attention to these indicators. The COT report shows that long non-commercial positions increased by 24,031 to 218,381, while short non-commercial positions fell by 12,790 to 125,543. As a result, the gap between long and short positions increased by 2,961.

This image is no longer relevant

Indicator signals:

Moving Averages:

Trading is conducted above the 30 and 50-day moving averages, indicating further growth for the pair.

Note: The period and prices of the moving averages are considered by the author on the hourly chart (H1), differing from the general definition of classic daily moving averages on the daily chart (D1).

Bollinger Bands:

In the event of a decline, the lower boundary of the indicator at around 1.1068 will serve as support.

Indicator descriptions:

  • Moving average: Determines the current trend by smoothing volatility and noise. Period: 50. Marked in yellow on the chart.
  • Moving average: Determines the current trend by smoothing volatility and noise. Period: 30. Marked in green on the chart.
  • MACD indicator (Moving Average Convergence/Divergence): Fast EMA period 12. Slow EMA period 26. SMA period 9.
  • Bollinger Bands: Period 20.
  • Non-commercial traders: Speculators, such as individual traders, hedge funds, and large institutions that use the futures market for speculative purposes and meet certain criteria.
  • Long non-commercial positions: The total long open position of non-commercial traders.
  • Short non-commercial positions: The total short open position of non-commercial traders.
  • Total non-commercial net position: The difference between the short and long positions of non-commercial traders.
Miroslaw Bawulski,
Analytical expert of InstaTrade
© 2007-2025

Recommended Stories

How to Trade the GBP/USD Pair on August 15? Simple Tips and Trade Analysis for Beginners

Analysis of Thursday's Trades 1H Chart of GBP/USD The GBP/USD pair also corrected slightly lower on Thursday amid the high PPI reading. As we have already mentioned, even such

Paolo Greco 06:13 2025-08-15 UTC+2

How to Trade the EUR/USD Pair on August 15? Simple Tips and Trade Analysis for Beginners

Analysis of Thursday's Trades 1H Chart of EUR/USD On Thursday, the EUR/USD currency pair traded lower. Four macroeconomic reports were published during the day, three of which had no impact

Paolo Greco 06:13 2025-08-15 UTC+2

Trading Recommendations and Trade Breakdown for GBP/USD on August 15: The Pound Pulled Back Slightly

On Thursday, the GBP/USD currency pair also traded lower, with the U.S. Producer Price Index being the main driver. Initially, we assumed that this indicator was unlikely to provoke

Paolo Greco 03:50 2025-08-15 UTC+2

Trading Recommendations and Trade Breakdown for EUR/USD on August 15: Inflation Sank the Dollar, Inflation Also Lent a Hand

On Thursday, the EUR/USD currency pair showed a decent decline, which fully aligns with the current technical picture. It should be noted that an uptrend does not mean the price

Paolo Greco 03:50 2025-08-15 UTC+2

How to Trade the GBP/USD Pair on August 14? Simple Tips and Trade Analysis for Beginners

Analysis of Wednesday's Trades 1H Chart of GBP/USD The GBP/USD pair also continued moving north on Wednesday, although there were no local reasons for this. Nevertheless, the British pound keeps

Paolo Greco 06:49 2025-08-14 UTC+2

How to Trade the EUR/USD Pair on August 14? Simple Tips and Trade Analysis for Beginners

Analysis of Wednesday's Trades 1H Chart of EUR/USD On Wednesday, the EUR/USD currency pair continued its upward movement. It was not a strong rise, but it was upward, in line

Paolo Greco 06:49 2025-08-14 UTC+2

Trading Recommendations and Trade Breakdown for GBP/USD on August 14: The Pound Surprises for the Second Day

On Wednesday, the GBP/USD currency pair continued its upward movement, despite the absence of significant reports, news from Donald Trump, and fundamental events during the day. Once again, we draw

Paolo Greco 03:52 2025-08-14 UTC+2

Trading Recommendations and Trade Breakdown for EUR/USD on August 14: Inflation Continues to Pressure the Dollar

On Wednesday, the EUR/USD currency pair continued its upward movement, despite the absence of any important events or reports during the day. However, the broader fundamental backdrop — driven

Paolo Greco 03:52 2025-08-14 UTC+2

How to Trade the GBP/USD Pair on August 13? Simple Tips and Trade Analysis for Beginners

Analysis of Tuesday's Trades 1H Chart of GBP/USD The GBP/USD pair also showed a relatively strong upward move, but unlike EUR/USD, it began rising from early morning. Data from

Paolo Greco 06:44 2025-08-13 UTC+2

How to Trade the EUR/USD Pair on August 13? Simple Tips and Trade Analysis for Beginners

Analysis of Tuesday's Trades 1H Chart of EUR/USD On Tuesday, the EUR/USD currency pair traded higher for a completely logical reason. The US Consumer Price Index showed a very unexpected

Paolo Greco 06:44 2025-08-13 UTC+2
Can't speak right now?
Ask your question in the chat.
 

Dear visitor,

Your IP address shows that you are currently located in the USA. If you are a resident of the United States, you are prohibited from using the services of InstaFintech Group including online trading, online transfers, deposit/withdrawal of funds, etc.

If you think you are seeing this message by mistake and your location is not the US, kindly proceed to the website. Otherwise, you must leave the website in order to comply with government restrictions.

Why does your IP address show your location as the USA?

  • - you are using a VPN provided by a hosting company based in the United States;
  • - your IP does not have proper WHOIS records;
  • - an error occurred in the WHOIS geolocation database.

Please confirm whether you are a US resident or not by clicking the relevant button below. If you choose the wrong option, being a US resident, you will not be able to open an account with InstaTrade anyway.

We are sorry for any inconvenience caused by this message.