empty
11.12.2024 01:59 PM
GBP/USD: Plan for the U.S. Session on December 11 (Review of Morning Trades). Pressure on the Pound Returns

In my morning forecast, I focused on the level of 1.2758 and planned to make trading decisions based on it. Let's look at the 5-minute chart and analyze what happened. A breakout and retest of 1.2758 from below provided an excellent entry point for selling the pound, resulting in a significant drop to the support level of 1.2725, yielding more than 30 points of profit. The technical picture has been revised for the second half of the day.

This image is no longer relevant

To Open Long Positions on GBP/USD:

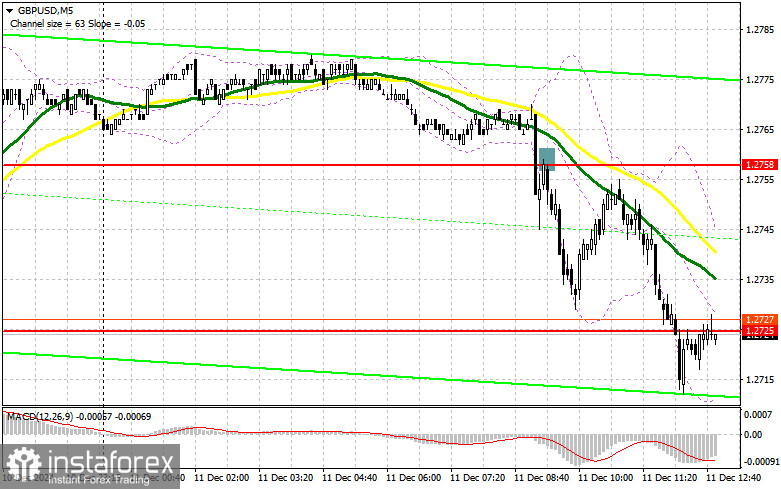
Considering how quickly pressure returned to the British pound, even in the absence of significant UK statistics, the pair's future upward prospects will entirely depend on U.S. inflation data. An increase in inflation would give the Federal Reserve reason to pause its rate-cutting pace, strengthening the dollar and causing further pound sell-offs. Otherwise, bulls could rebound from the new support at 1.2717, maintaining chances for a recovery.

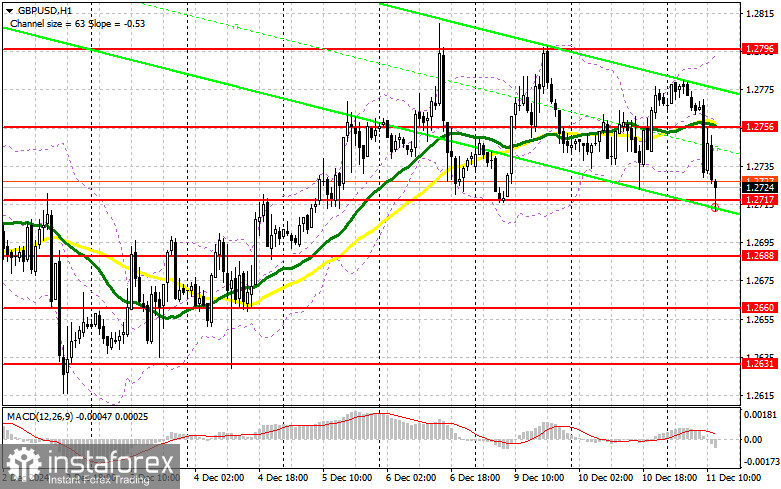
A false breakout at 1.2717 will provide a good entry point for buying, aiming for a rebound of GBP/USD toward the resistance at 1.2756, which served as support earlier in the day. A breakout and retest of this range from above will create a new entry point for long positions, targeting 1.2796. The ultimate target will be the 1.2827 level, where I plan to take profits.

If GBP/USD declines and there is no bull activity around 1.2717—likely coupled with strong U.S. data—it could lead to a breach of the lower boundary of the sideways channel. In this case, only a false breakout near the next support level at 1.2688 will provide a suitable condition for opening long positions. I will buy GBP/USD immediately on a rebound from the 1.2660 low, aiming for a 30-35 point correction within the day.

To Open Short Positions on GBP/USD:

If the pound rises following the data, defending the nearest resistance at 1.2756 will be a priority for sellers. A false breakout there will provide an entry point for short positions, targeting the lower boundary of the sideways channel and support at 1.2717, which was established earlier in the day. A breakout and retest of this range from below will trigger stop-loss orders, opening the path toward 1.2677, which would be a significant blow to the bulls. The ultimate target will be the 1.2688 level, where I plan to take profits.

If demand for the pound persists in the second half of the day—likely only if U.S. data is weak—and GBP/USD rises without activity at 1.2756 (where moving averages favor sellers), buyers will have a good chance to establish a bullish trend. In this case, sellers will retreat toward the resistance at 1.2796, where I will sell only after a false breakout. If there is no downward movement there, I will look for short positions on a rebound near 1.2827, targeting a 30-35 point downward correction within the day.

This image is no longer relevant

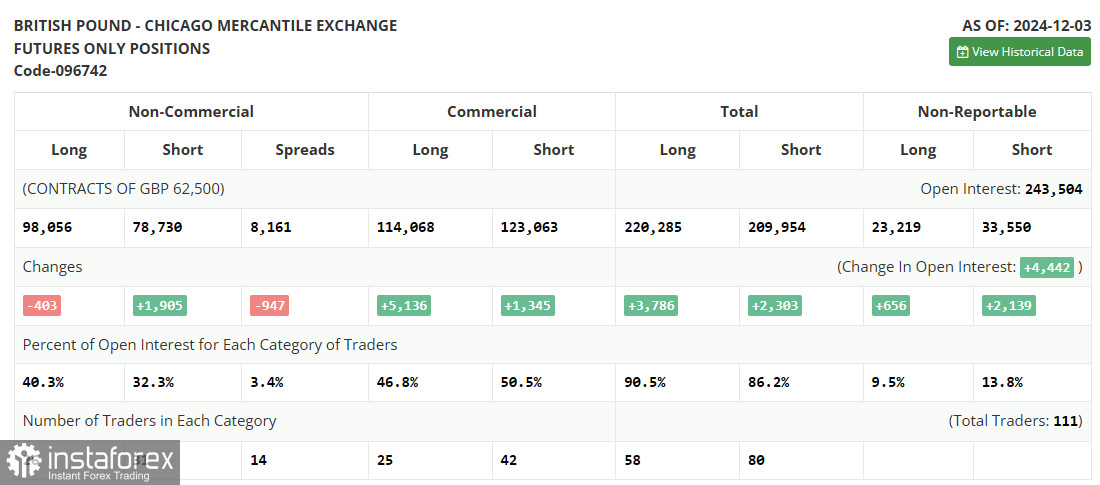
The COT Report (Commitment of Traders) for December 3 showed a decrease in long positions and an increase in short positions. The Bank of England's next steps regarding interest rates remain uncertain. However, in the event of weak GDP data expected soon, the likelihood of rate cuts will rise, putting pressure on the pound against the U.S. dollar. If this does not occur, buyers will have a chance for a more significant recovery in the GBP/USD pair. According to the latest COT report, long non-commercial positions decreased by 403 to 98,056, while short non-commercial positions increased by 1,905 to 78,730. As a result, the gap between long and short positions narrowed by 947.

This image is no longer relevant

Indicator Signals:

  • Moving Averages: Trading is below the 30- and 50-day moving averages, indicating further potential declines.
    • Note: The moving averages referenced by the author are on the hourly H1 chart and differ from classic daily moving averages on the D1 chart.
  • Bollinger Bands: The lower boundary of the indicator around 1.2717 will act as support in case of a decline.

Indicator Descriptions:

  • Moving Average (MA): Identifies the current trend by smoothing volatility and noise. Period – 50 (yellow on the chart); Period – 30 (green on the chart).
  • MACD Indicator: (Moving Average Convergence/Divergence – convergence/divergence of moving averages). Fast EMA – period 12. Slow EMA – period 26. SMA – period 9.
  • Bollinger Bands: Period – 20.
  • Non-Commercial Traders: Speculators, such as individual traders, hedge funds, and large institutions using the futures market for speculative purposes.
  • Long Non-Commercial Positions: Total long open positions held by non-commercial traders.
  • Short Non-Commercial Positions: Total short open positions held by non-commercial traders.
  • Net Non-Commercial Position: The difference between short and long positions held by non-commercial traders.
Miroslaw Bawulski,
Analytical expert of InstaTrade
© 2007-2025

Recommended Stories

Trading Recommendations and Analysis for GBP/USD on June 30: Cold North is Better Than the Warm South

On Friday, the GBP/USD currency pair saw only a slight correction after its strong rally. Once again, we observe a market with no apparent desire to take profits from long

Paolo Greco 07:07 2025-06-30 UTC+2

Trading Recommendations and Analysis for EUR/USD on June 30: Another Flat Phase at the Highs

On Friday, the EUR/USD currency pair stood still. Once again, we are observing a situation where the price rises (often strongly) for some time and then just waits. It waits

Paolo Greco 07:07 2025-06-30 UTC+2

How to Trade the GBP/USD Pair on June 30? Simple Tips and Trade Analysis for Beginners

Analysis of Friday's Trades 1H Chart of GBP/USD The GBP/USD pair also traded rather calmly on Friday. However, unlike the EUR/USD pair, traders didn't find it necessary to react

Paolo Greco 06:02 2025-06-30 UTC+2

How to Trade the EUR/USD Pair on June 30? Simple Tips and Trade Analysis for Beginners

Analysis of Friday's Trades 1H Chart of EUR/USD The EUR/USD currency pair showed no significant movements on Friday. For most of the day, the price remained in a sideways range

Paolo Greco 06:02 2025-06-30 UTC+2

GBP/USD: Trading Plan for the U.S. Session on June 27th (Review of Morning Trades)

In my morning forecast, I highlighted the 1.3720 level and planned to make trading decisions based on it. Let's take a look at the 5-minute chart and examine what happened

Miroslaw Bawulski 13:06 2025-06-27 UTC+2

EUR/USD: Trading Plan for the U.S. Session on June 27th (Review of Morning Trades)

In my morning forecast, I highlighted the 1.1709 level and planned to make trading decisions based on it. Let's take a look at the 5-minute chart and analyze what happened

Miroslaw Bawulski 13:01 2025-06-27 UTC+2

How to Trade the GBP/USD Pair on June 27? Simple Tips and Trade Analysis for Beginners

Analysis of Thursday's Trades 1H Chart of GBP/USD On Thursday, the GBP/USD pair also remained in an upward trend, and there was no shortage of significant developments across the Atlantic

Paolo Greco 06:42 2025-06-27 UTC+2

How to Trade the EUR/USD Pair on June 27? Simple Tips and Trade Analysis for Beginners

Analysis of Thursday's Trades 1H Chart of EUR/USD On Thursday, the EUR/USD currency pair traded mostly sideways, albeit with a slight upward bias. The uptrend on the hourly timeframe remains

Paolo Greco 06:42 2025-06-27 UTC+2

Trading Recommendations and Analysis for GBP/USD on June 27: The Pound Soars Again

The GBP/USD currency pair continued its upward movement on Thursday, which began back on Monday. Practically without pauses, the British pound surged 350 pips in just four days

Paolo Greco 03:41 2025-06-27 UTC+2

Trading Recommendations and Analysis for EUR/USD on June 27: Trump Hits the Dollar Again

The EUR/USD currency pair continued its strong upward movement throughout Thursday. A new wave of growth for the European currency began on Wednesday evening and continued into Thursday night. Therefore

Paolo Greco 03:41 2025-06-27 UTC+2
Can't speak right now?
Ask your question in the chat.
 

Dear visitor,

Your IP address shows that you are currently located in the USA. If you are a resident of the United States, you are prohibited from using the services of InstaFintech Group including online trading, online transfers, deposit/withdrawal of funds, etc.

If you think you are seeing this message by mistake and your location is not the US, kindly proceed to the website. Otherwise, you must leave the website in order to comply with government restrictions.

Why does your IP address show your location as the USA?

  • - you are using a VPN provided by a hosting company based in the United States;
  • - your IP does not have proper WHOIS records;
  • - an error occurred in the WHOIS geolocation database.

Please confirm whether you are a US resident or not by clicking the relevant button below. If you choose the wrong option, being a US resident, you will not be able to open an account with InstaTrade anyway.

We are sorry for any inconvenience caused by this message.