empty
24.01.2025 10:21 AM
EUR/USD and GBP/USD on January 24 - Technical Analysis of the Situation

EUR/USD

This image is no longer relevant

Higher Timeframes

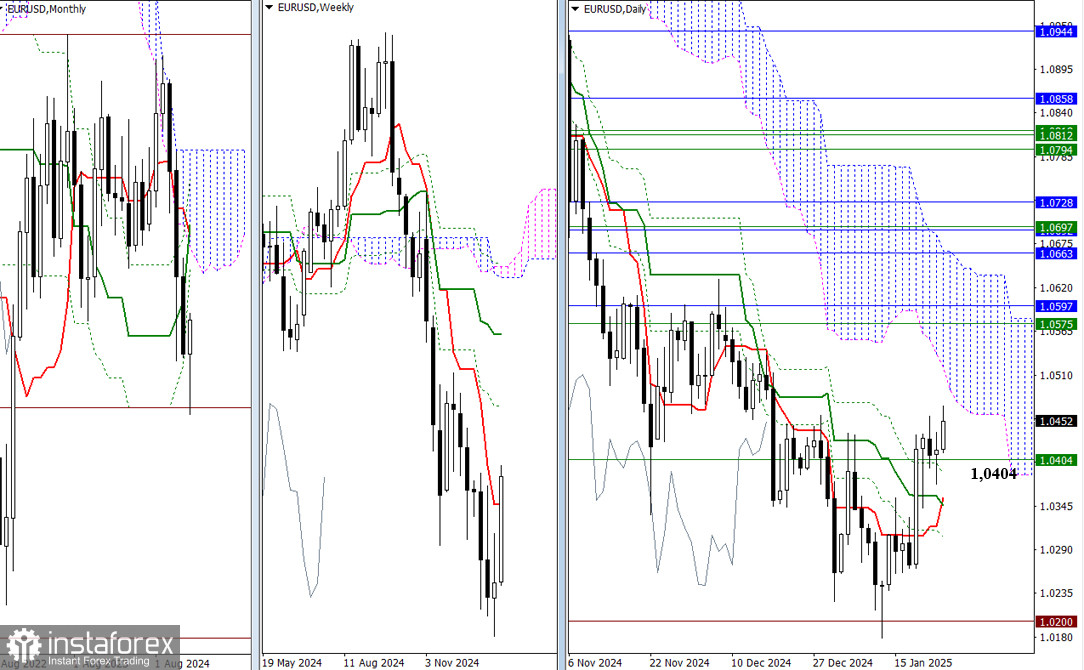
Bullish traders are looking to maintain their current positions and potentially push the pair higher. Since today is Friday, the weekly close will be significant. An ideal scenario for the bulls would be a weekly candle with minimal upper shadow. The nearest upward target is the lower boundary of the daily Ichimoku cloud at 1.0520, followed by weekly resistance at 1.0575 and monthly resistance at 1.0597. On the other hand, bearish traders are focused on the influence zone of the weekly short-term trend at 1.0404. Trading below this level would lead to a test of the daily Ichimoku cross supports at 1.0385, 1.0355, 1.0346, and 1.0307. If the cross is broken, bearish plans may resume, targeting 1.0179.

This image is no longer relevant

H4 – H1

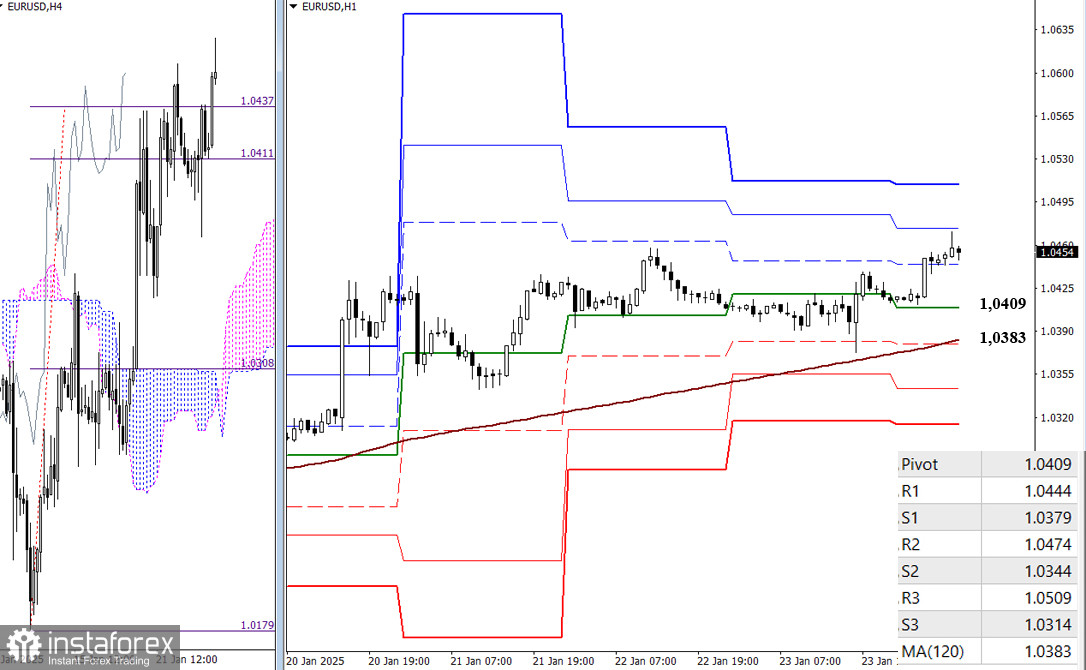
On the lower timeframes, bullish traders still hold the primary advantage and are attempting to break through the tested H4 Ichimoku cloud breakout target at 1.0437 to continue their upward movement. Intraday bullish targets include the classic Pivot resistance levels, with R2 at 1.0474 and R3 at 1.0509, which have not yet been reached today. However, a corrective decline and a break below the key levels converging around 1.0409 to 1.0383 (daily central Pivot level plus weekly long-term trend) could disrupt the current balance of power. Such a shift would render bearish intraday targets relevant again, including support levels at the classic Pivot points (1.0379, 1.0344, 1.0314).

***

GBP/USD

This image is no longer relevant

Higher Timeframes

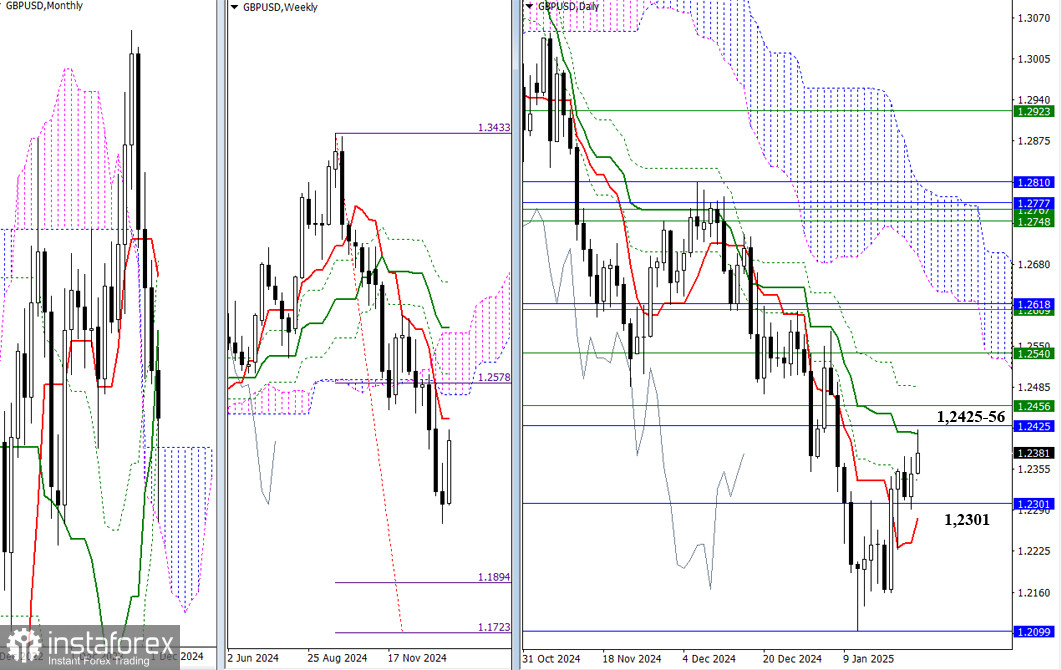
On the last trading day of the week, bullish players have begun testing resistance levels clustered around 1.2411, 1.2425, 1.2456, and 1.2485. A successful breakout above these levels would enable bulls to achieve key objectives, such as overcoming the daily Ichimoku dead cross and regaining the weekly short-term trend. However, if the bulls fail to break through, the pair will likely interact with the nearest support zone at 1.2338, 1.2301, and 1.2277, which correspond to the daily Ichimoku cross levels and the upper boundary of the monthly Ichimoku cloud.

This image is no longer relevant

H4 – H1

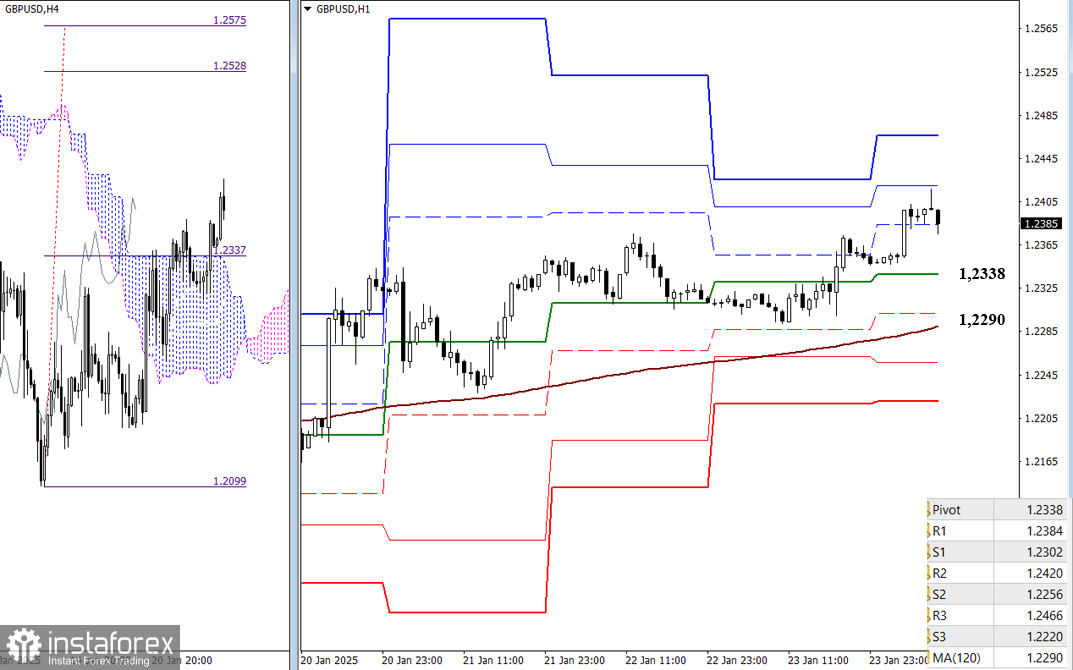
Bullish players continue to hold the advantage on lower timeframes. On the H4 chart, an upward target has been established for breaking the Ichimoku cloud at 1.2528 and 1.2575. Additional intraday resistance levels include the classic Pivot levels at 1.2420 and 1.2446. Key levels to watch today are at 1.2338 and 1.2290, which correspond to the daily central Pivot level and the weekly long-term trend. A break below these levels could lead to a trend reversal, altering the current balance of power. Additional targets for bearish players include the classic Pivot support levels at 1.2302, 1.2256, and 1.2220.

***

Technical Analysis Components:
  • Higher Timeframes: Ichimoku Kinko Hyo (9.26.52) and Fibonacci Kijun levels
  • H1: Classic Pivot Points and 120-period Moving Average (weekly long-term trend)
Evangelos Poulakis,
Analytical expert of InstaTrade
© 2007-2025

Recommended Stories

Forecast for EUR/USD on June 13, 2025

On Thursday, the EUR/USD pair continued its upward movement and consolidated above the 100.0% Fibonacci retracement level at 1.1574. However, during the night, a sharp reversal occurred in favor

Samir Klishi 11:52 2025-06-13 UTC+2

Forecast for GBP/USD on June 13, 2025

On the hourly chart, the GBP/USD pair on Thursday rebounded from the 1.3520 level, surged to the resistance zone of 1.3611–1.3620, bounced off it twice, and then fell back

Samir Klishi 11:49 2025-06-13 UTC+2

EUR/USD. June 12. A Setback for the Dollar

Good day, dear traders! On Wednesday, the EUR/USD pair continued its upward movement after rebounding from the support zone of 1.1374–1.1380. It successfully consolidated above the 76.4% Fibonacci retracement level

Samir Klishi 10:15 2025-06-12 UTC+2

GBP/USD. June 12. British Economy Falters

Good day, dear traders! On the hourly chart, on Wednesday, the GBP/USD pair reversed in favor of the British pound and consolidated above the 161.8% Fibonacci retracement level at 1.3520

Samir Klishi 10:15 2025-06-12 UTC+2

Technical Analysis of Daily Price Movement Crude Oil Commodity Instrument, Thursday June 12, 2025.

If we look at the daily chart of the Crude Oil commodity instrument, there appears to be a Divergence between the price movement of #CL and the Stochastic Oscillator indicator

Arief Makmur 08:10 2025-06-12 UTC+2

Technical Analysis of Intraday Price Movement of Nasdaq 100 Index, Thursday June 12, 2025.

On the 4-hour chart of the Nasdaq 100 index, there is a divergence between its price movement and the Stochastic Oscillator indicator, especially with the current confirmation of the price

Arief Makmur 08:10 2025-06-12 UTC+2

Trading Signals for EUR/USD for June 12-19, 2025: sell below 1.1500 (21 SMA - 8/8 Murray)

If the euro price falls below 1.1500 in the coming hours, this could be seen as an opportunity to sell. Technically, it appears overbought on the H4 chart and could

Dimitrios Zappas 05:33 2025-06-12 UTC+2

Trading Signals for GOLD (XAU/USD) for June 12-19, 2025: sell below $3,386 (21 SMA - 7/8 Murray)

The XAU/USD trend remains bullish as long as the price consolidates above 3,331. Therefore, it would be prudent to buy gold as long as the price consolidates above 3,359, where

Dimitrios Zappas 05:32 2025-06-12 UTC+2

EUR/USD Forecast for June 12, 2025

The U.S. inflation data released on Wednesday stirred the markets: the dollar index dropped by 0.47%, WTI oil surged by 5.54%, gold rose by 1.27%, and 5-year U.S. Treasury yields

Laurie Bailey 04:40 2025-06-12 UTC+2

GBP/USD Forecast for June 12, 2025

On Wednesday, the British pound successfully avoided a decline below technical support levels, reversing upward from them. The price rebounded from the MACD indicator line on the daily chart, while

Laurie Bailey 04:40 2025-06-12 UTC+2
Can't speak right now?
Ask your question in the chat.
 

Dear visitor,

Your IP address shows that you are currently located in the USA. If you are a resident of the United States, you are prohibited from using the services of InstaFintech Group including online trading, online transfers, deposit/withdrawal of funds, etc.

If you think you are seeing this message by mistake and your location is not the US, kindly proceed to the website. Otherwise, you must leave the website in order to comply with government restrictions.

Why does your IP address show your location as the USA?

  • - you are using a VPN provided by a hosting company based in the United States;
  • - your IP does not have proper WHOIS records;
  • - an error occurred in the WHOIS geolocation database.

Please confirm whether you are a US resident or not by clicking the relevant button below. If you choose the wrong option, being a US resident, you will not be able to open an account with InstaTrade anyway.

We are sorry for any inconvenience caused by this message.