empty
05.03.2025 08:11 AM
EUR/USD and GBP/USD March 5 – Technical Analysis

EUR/USD

This image is no longer relevant

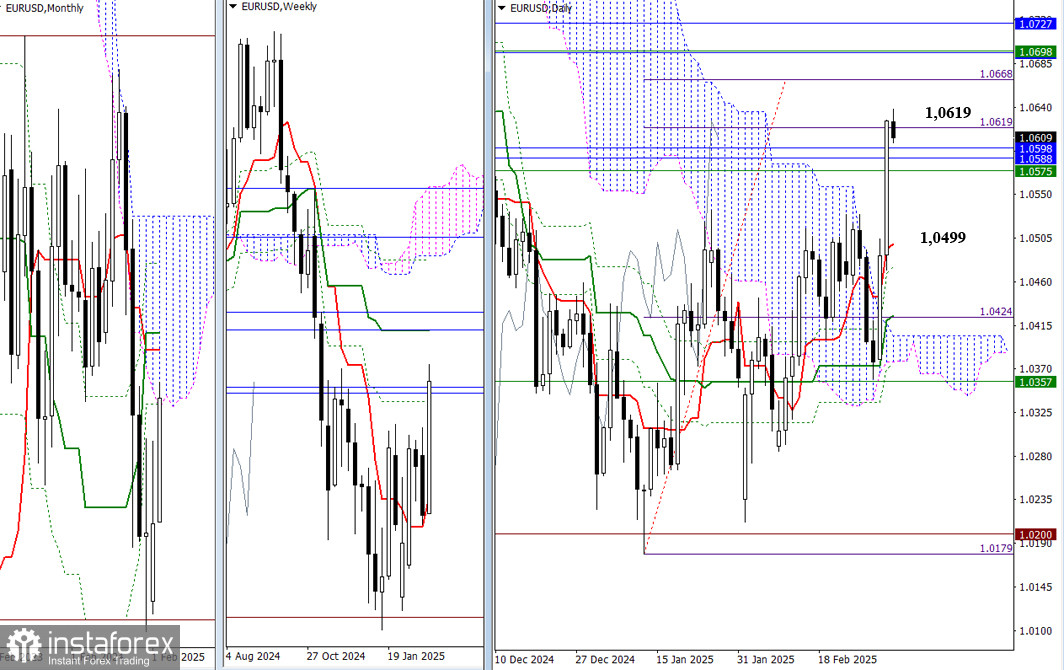
The start of the new week gives bullish traders a reason to remain optimistic and effective. They have not only exited the daily Ichimoku cloud, creating a breakout target, but have also quickly reached the initial target level of 1.0619. In this context, the next bullish targets can be identified at 1.0668, 1.0698, and 1.0727. Achieving these levels would fully realize the daily breakout target while simultaneously testing the key resistances of the monthly Ichimoku cross and the medium-term weekly trend.

Yesterday, on the way to reaching the target level of 1.0619, the pair surpassed several strong resistance levels at 1.0575, 1.0588, and 1.0598, thereby entering the monthly cloud. Today, these breached levels may serve as support on lower timeframes, helping the bulls maintain their gains.

This image is no longer relevant

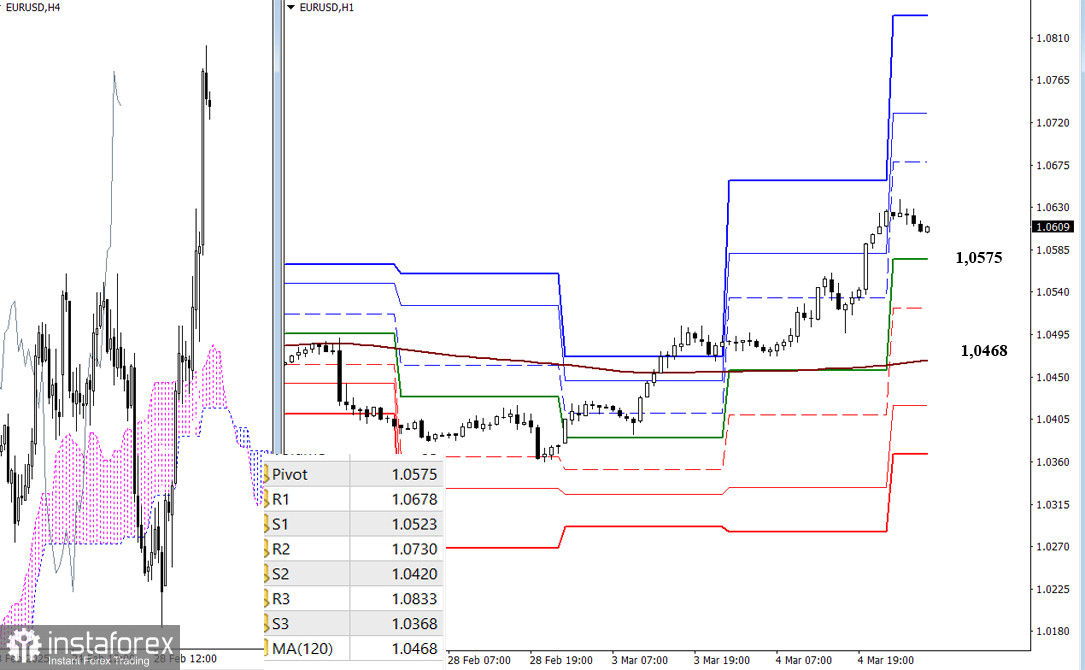
On the lower timeframes, the bulls currently hold the main advantage, as we observe an uptrend formation. Intraday bullish targets today are set at 1.0678, 1.0730, and 1.0833 (the resistances of the classic Pivot levels). A downward correction could jeopardize the testing of key levels at 1.0575 (the central daily Pivot level) and 1.0468 (the weekly long-term trend), with an intermediate support at S1 positioned at 1.0523. A breakout and subsequent trend reversal could significantly shift the balance of power. Further strengthening of bearish sentiment would likely unfold through the classic Pivot level supports at 1.0420 and 1.0368.

***

GBP/USD

This image is no longer relevant

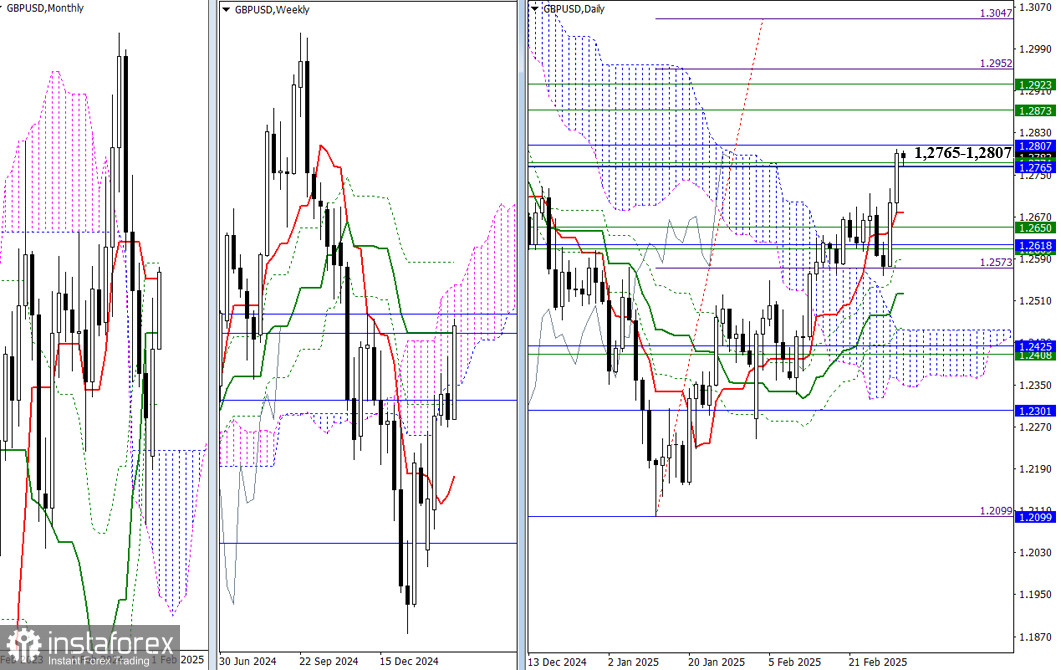
In the first two days of the new week, the bulls have achieved what they were unable to accomplish in the previous two weeks. The pair is currently testing the resistance levels of the monthly Ichimoku cross at 1.2765–1.2807 and the medium-term weekly trend at 1.2766. If these levels are broken, the next targets will include a breakout from the weekly cloud at 1.2873, the elimination of the weekly Ichimoku cross at 1.2923, and reaching the daily breakout target of 1.2952–1.3047. However, if the bulls fail and the upward movement is halted, the pair could return to previously crossed levels around 1.2650–1.2618, with the first support encountered at the daily short-term trend of 1.2678.

This image is no longer relevant

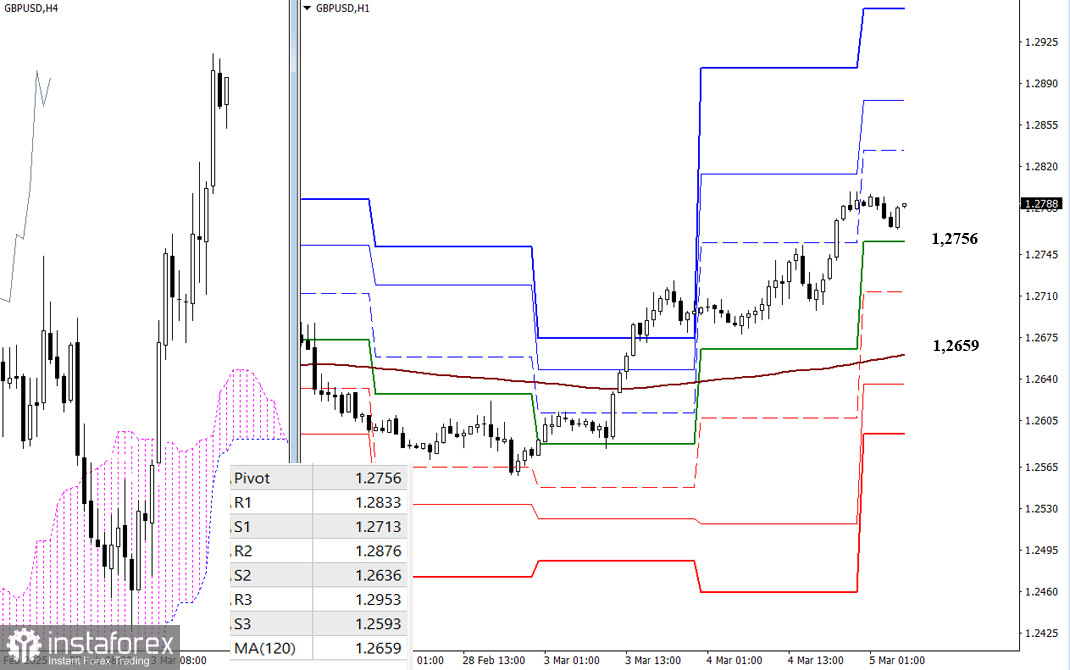
Currently, the bulls hold a significant advantage on the lower timeframes. To continue the uptrend, intraday targets are set at the classic Pivot level resistances of 1.2833, 1.2876, and 1.2953. If the bears manage to take control, their key support levels will be at 1.2756 (the central daily Pivot level) and 1.2659 (the weekly long-term trend). A breakout and trend reversal could shift the balance of power in favor of the bears, leading to a further strengthening of bearish sentiment. Additional intraday targets for bearish traders include the classic Pivot level supports at 1.2713, 1.2636, and 1.2593.

***

Technical Analysis Components:
  • Higher Timeframes: Ichimoku Kinko Hyo (9.26.52) and Fibonacci Kijun levels
  • H1: Classic Pivot Points and 120-period Moving Average (weekly long-term trend)
Evangelos Poulakis,
Analytical expert of InstaTrade
© 2007-2025

Recommended Stories

Forecast for EUR/USD on June 10, 2025

On Monday, the EUR/USD pair traded sideways between the levels of 1.1380 and 1.1454, forming a range. Therefore, a rebound from the support zone of 1.1374–1.1380 would favor the euro

Samir Klishi 10:33 2025-06-10 UTC+2

GBP/USD. June 10th. Unemployment Rises in the UK

On the hourly chart, the GBP/USD pair on Monday made two rebounds from the 161.8% corrective level at 1.3520 but failed to start an upward movement. Today, on Tuesday

Samir Klishi 10:21 2025-06-10 UTC+2

Technical Analysis of Intraday Price Movement of EUR/USD Main Currency Pairs, Tuesday June 10 2025.

With the appearance of the Ascending Broadening Wedge pattern followed by the appearance of the Bearish 123 pattern, it gives an indication that in the near future EUR/USD

Arief Makmur 05:59 2025-06-10 UTC+2

Technical Analysis of Intraday Price Movement of GBP/JPY Cross Currency Pairs, Tuesday June 10, 2025.

On the 4-hour chart of the GBP/JPY cross currency pair, there are several interesting things can be seen. First, the price movement is moving above the WMA (21) which

Arief Makmur 05:59 2025-06-10 UTC+2

Forecast for EUR/USD on June 10, 2025

Monday passed calmly in the markets, and the main takeaway was the restoration of risk-related correlations. The euro bounced back from the daily MACD line support for the second consecutive

Laurie Bailey 04:52 2025-06-10 UTC+2

Forecast for GBP/USD on June 10, 2025

On Monday, the British pound closed with a small gain. This pattern has become common over the past week—growth marked by small white candles, while declines occur through extended black

Laurie Bailey 04:48 2025-06-10 UTC+2

AUD/USD Forecast for June 10, 2025

The Australian dollar has shown moderate growth of more than a figure over the past 10 days, but the Marlin oscillator's reluctance to follow this upward move is causing concern

Laurie Bailey 04:46 2025-06-10 UTC+2

Trading Signals for GOLD (XAU/USD) for June 9-12, 2025: sell below $3,350 (21 SMA - 7/8 Murray)

Early in the American session, gold is trading around 3,317, rebounding after reaching a low of 3,294 during the European session. On the H4 chart, gold could continue to rise

Dimitrios Zappas 15:23 2025-06-09 UTC+2

Trading Signals for EUR/USD for June 9-12, 2025: sell below 1.1415 (21 SMA - 6/8 Murray)

We believe the euro could continue to fall as a bearish continuation pattern is forming, but we should expect it to fall below 1.1400, which could then reach the bottom

Dimitrios Zappas 15:20 2025-06-09 UTC+2

EUR/USD. Analysis and Forecast

Today, the EUR/USD pair is attracting buyers, recovering part of Friday's losses amid a weaker U.S. dollar. From a technical perspective, the EUR/USD pair is currently showing resilience below

Irina Yanina 13:57 2025-06-09 UTC+2
Can't speak right now?
Ask your question in the chat.
 

Dear visitor,

Your IP address shows that you are currently located in the USA. If you are a resident of the United States, you are prohibited from using the services of InstaFintech Group including online trading, online transfers, deposit/withdrawal of funds, etc.

If you think you are seeing this message by mistake and your location is not the US, kindly proceed to the website. Otherwise, you must leave the website in order to comply with government restrictions.

Why does your IP address show your location as the USA?

  • - you are using a VPN provided by a hosting company based in the United States;
  • - your IP does not have proper WHOIS records;
  • - an error occurred in the WHOIS geolocation database.

Please confirm whether you are a US resident or not by clicking the relevant button below. If you choose the wrong option, being a US resident, you will not be able to open an account with InstaTrade anyway.

We are sorry for any inconvenience caused by this message.