empty
16.03.2025 11:25 PM
SPX – Weekly Results and Future Prospects

This image is no longer relevant

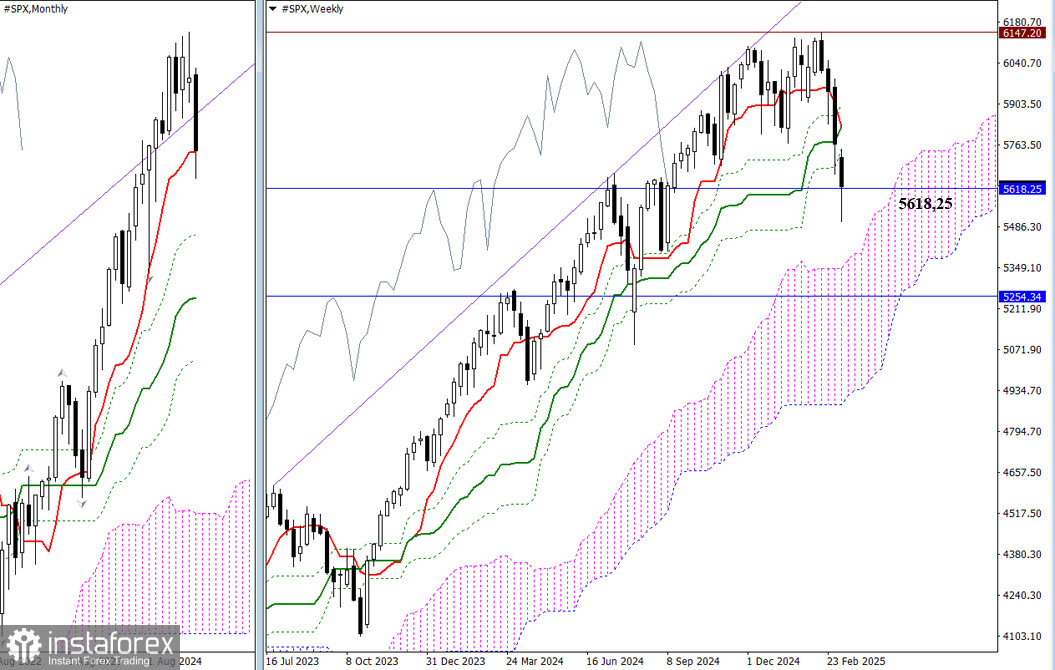
Last week, the bears continued to decline but failed to close below the tested support level of the monthly short-term trend at 5618.25, only leaving a long lower shadow beyond it. A break below this level would lead to a retest of the weekly Ichimoku cross, which ranges from 5749.63, 5825.54 to 5901.45. If a breakdown occurs, it would signify the continuation of the monthly downward correction towards the next support level at 5254.34, which is now reinforced by the weekly Ichimoku cloud, ranging from 5396.85 to 4936.71.

This image is no longer relevant

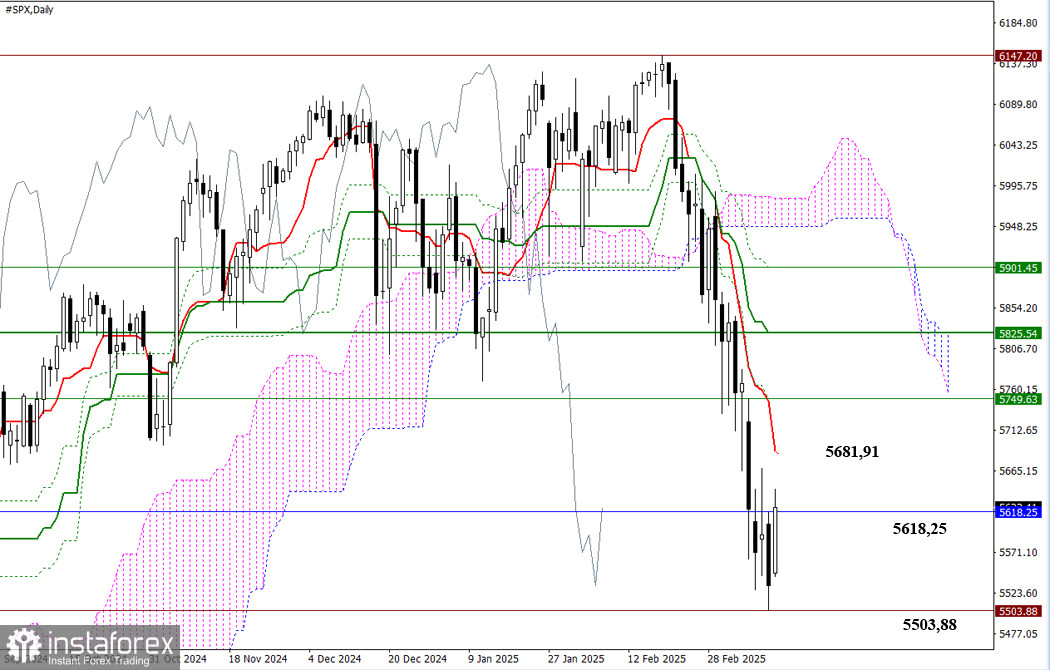
In the daily timeframe, it is evident that after initially dropping below the monthly support level of 5618.25 at the beginning of the week, the SPX has been attempting to recover and consolidate above this lost level for the remainder of the week. If the bulls continue to regain their positions, a full upward correction towards the daily short-term trend at 5681.91 will first need to take place. Conversely, if bearish activity returns to the market, the bears must update the minimum extremum at 5503.88 to unveil new prospects.

This image is no longer relevant

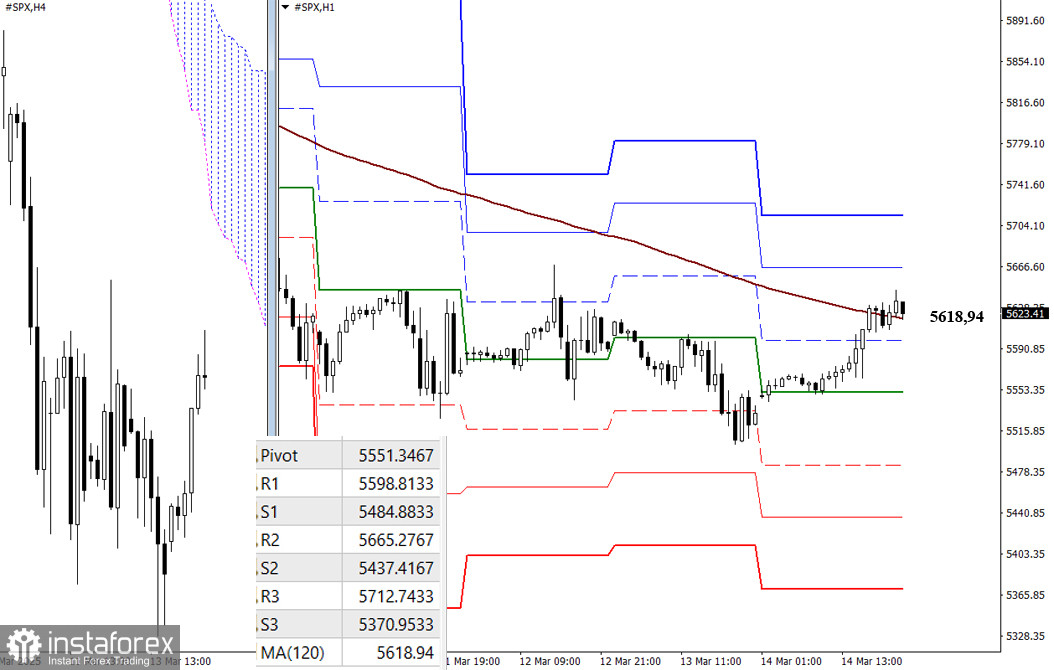
The current weekly long-term trend is at 5618.94 and is being tested on the lower timeframes. Holding above this level provides a significant advantage. If the trend breaks and moves upward, it could strengthen bullish sentiment. Conversely, if there is a retracement and the price moves below the trend, it may indicate a continuation of the downward movement.

Additionally, the supports and resistances indicated by the classic Pivot levels serve as important reference points throughout the day. These levels are updated daily, and new relevant data will become available when the market opens.

***

Technical Analysis Components:
  • Higher Timeframes: Ichimoku Kinko Hyo (9.26.52) and Fibonacci Kijun levels
  • H1: Classic Pivot Points and 120-period Moving Average (weekly long-term trend)
Evangelos Poulakis,
Analytical expert of InstaTrade
© 2007-2025

Recommended Stories

XAU/USD. Analysis and Forecast

Gold is currently holding on to its intraday losses. Overall positive sentiment in the stock markets is undermining demand for bullion. However, a combination of factors is preventing bears from

Irina Yanina 12:18 2025-06-16 UTC+2

Forecast for EUR/USD on June 16, 2025

On Friday, the EUR/USD pair reversed in favor of the U.S. dollar and consolidated below the 100.0% Fibonacci correction level at 1.1574. This did not happen without reason, which

Samir Klishi 12:02 2025-06-16 UTC+2

Forex forecast 16/06/2025: EUR/USD, GBP/USD, USD/JPY, Oil, Gold and Bitcoin

Useful links: My other articles are available in this section InstaForex course for beginners Popular Analytics Open trading account Important: The begginers in forex trading need to be very careful

Sebastian Seliga 10:30 2025-06-16 UTC+2

GBP/USD – June 16th: Bulls Hold the 1.3527 Level

On the hourly chart, the GBP/USD pair on Friday rebounded twice from the 127.2% Fibonacci retracement level at 1.3527 and rose toward the resistance zone of 1.3611–1.3633. However, prior

Samir Klishi 10:27 2025-06-16 UTC+2

Technical Analysis of Daily Price Movement of USD/IDR Exotic Currency Pairs, Monday June 16, 2025.

With the appearance of the Bullish 123 pattern in the midst of the weakening conditions of this exotic currency pair, that has been confirmed by the movement of the USD/IDR

Arief Makmur 07:16 2025-06-16 UTC+2

Technical Analysis of Intraday Price Movement of Crude Oil Commodity Instrument, Monday June 16, 2025.

On the 4-hour chart of the Crude Oil commodity instrument, there is an appearance of Divergence between the #CL price movement and the Stochastic Oscillator indicator, indicating that

Arief Makmur 07:16 2025-06-16 UTC+2

Trading Signals for EUR/USD for June 13-19, 2025: buy above 1.1500 (21 SMA - 7/8 Murray)

Under the opposite scenario, if the euro falls below 1.1490, it is likely to reach the 200 EMA, which is located at 1.1340 and coincides with the bottom

Dimitrios Zappas 14:14 2025-06-13 UTC+2

Trading Signals for GOLD for June 13-19, 2025: sell below 3,343 (21 SMA - 8/8 Murray)

Gold has left a gap at 3,282 and another around 3,181. So, if the price falls below the psychological level of 3,300, we could expect it to fall to cover

Dimitrios Zappas 14:12 2025-06-13 UTC+2

Forecast for EUR/USD on June 13, 2025

On Thursday, the EUR/USD pair continued its upward movement and consolidated above the 100.0% Fibonacci retracement level at 1.1574. However, during the night, a sharp reversal occurred in favor

Samir Klishi 11:52 2025-06-13 UTC+2

Forecast for GBP/USD on June 13, 2025

On the hourly chart, the GBP/USD pair on Thursday rebounded from the 1.3520 level, surged to the resistance zone of 1.3611–1.3620, bounced off it twice, and then fell back

Samir Klishi 11:49 2025-06-13 UTC+2
Can't speak right now?
Ask your question in the chat.
 

Dear visitor,

Your IP address shows that you are currently located in the USA. If you are a resident of the United States, you are prohibited from using the services of InstaFintech Group including online trading, online transfers, deposit/withdrawal of funds, etc.

If you think you are seeing this message by mistake and your location is not the US, kindly proceed to the website. Otherwise, you must leave the website in order to comply with government restrictions.

Why does your IP address show your location as the USA?

  • - you are using a VPN provided by a hosting company based in the United States;
  • - your IP does not have proper WHOIS records;
  • - an error occurred in the WHOIS geolocation database.

Please confirm whether you are a US resident or not by clicking the relevant button below. If you choose the wrong option, being a US resident, you will not be able to open an account with InstaTrade anyway.

We are sorry for any inconvenience caused by this message.