empty
01.04.2025 11:29 AM
GBP/USD. April 1. A Month of Sideways Movement and the Threat of New Tariffs

On the hourly chart, the GBP/USD pair continued to trade sideways on Monday. Currently, there is no dominance of either bulls or bears in the market. This has been the case for an entire month. The 1.2931 level is not strong, so it's not a point to look for trading opportunities.

This image is no longer relevant

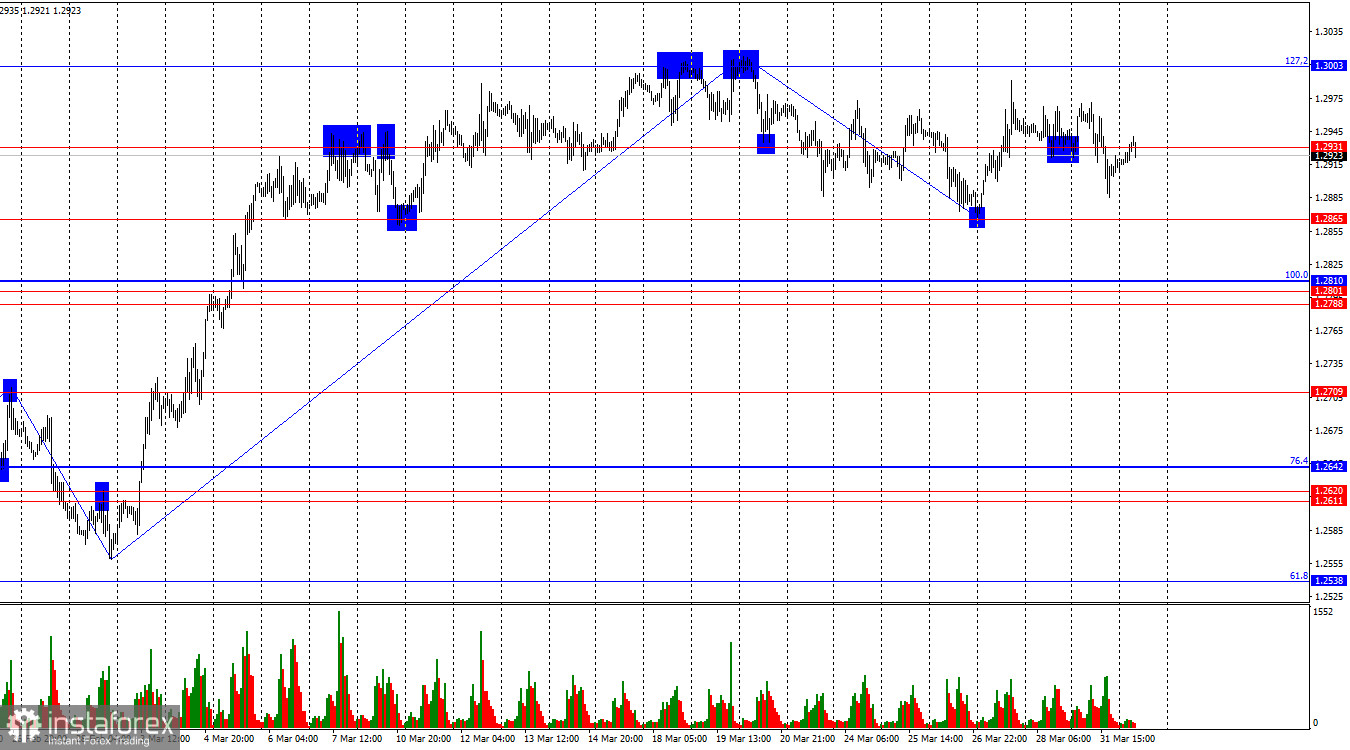
The wave situation is completely clear. The last completed downward wave did not break the low of the previous wave, while the last upward wave broke the previous high. Thus, a "bullish" trend is still forming. Most traders still do not want to buy the U.S. dollar regardless of economic data, since Donald Trump continues to introduce new tariffs that are expected to hurt U.S. and global economic growth in the future. For the bullish trend to start transforming into a bearish one, a consolidation below the 1.2865 level is needed.

There was virtually no fundamental background on Monday. While Germany released some reports, the UK had nothing noteworthy. In the U.S., the Chicago Business Activity Index came out better than expected – 47.6 vs. the forecast of 45.2. However, this report provided little support to the bears. Traders are currently hesitant to act because Donald Trump may announce new import tariffs for the U.S. today or tomorrow. No one knows what these tariffs will be, and trying to predict Trump's decisions is like reading tea leaves. Therefore, most traders prefer to wait for the official announcement of new tariff measures before making decisions. Waiting is currently the best strategy. This week, Trump mentioned that he is considering reciprocal tariffs for all countries globally, but he could easily change his stance. The market is on hold.

This image is no longer relevant

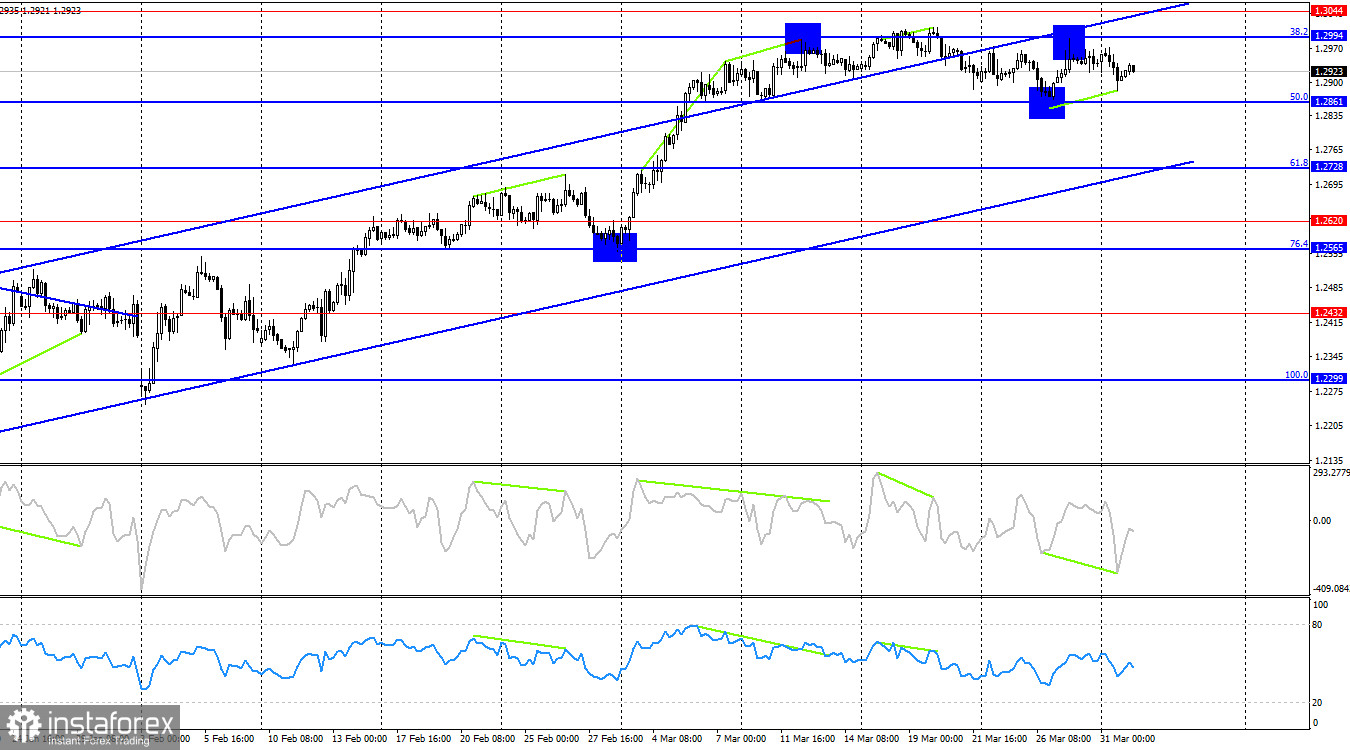
On the 4-hour chart, the pair maintains a bullish trend. A strong drop in the pound is unlikely unless there's a breakout below the ascending channel. A rebound from the 38.2% Fibonacci level at 1.2994 will again work in favor of the dollar and a decline toward the 50.0% corrective level at 1.2861. However, the bullish divergence on the CCI indicator allows for a slight upward movement. On the hourly chart, the pair is clearly range-bound.

Commitments of Traders (COT) Report:

This image is no longer relevant

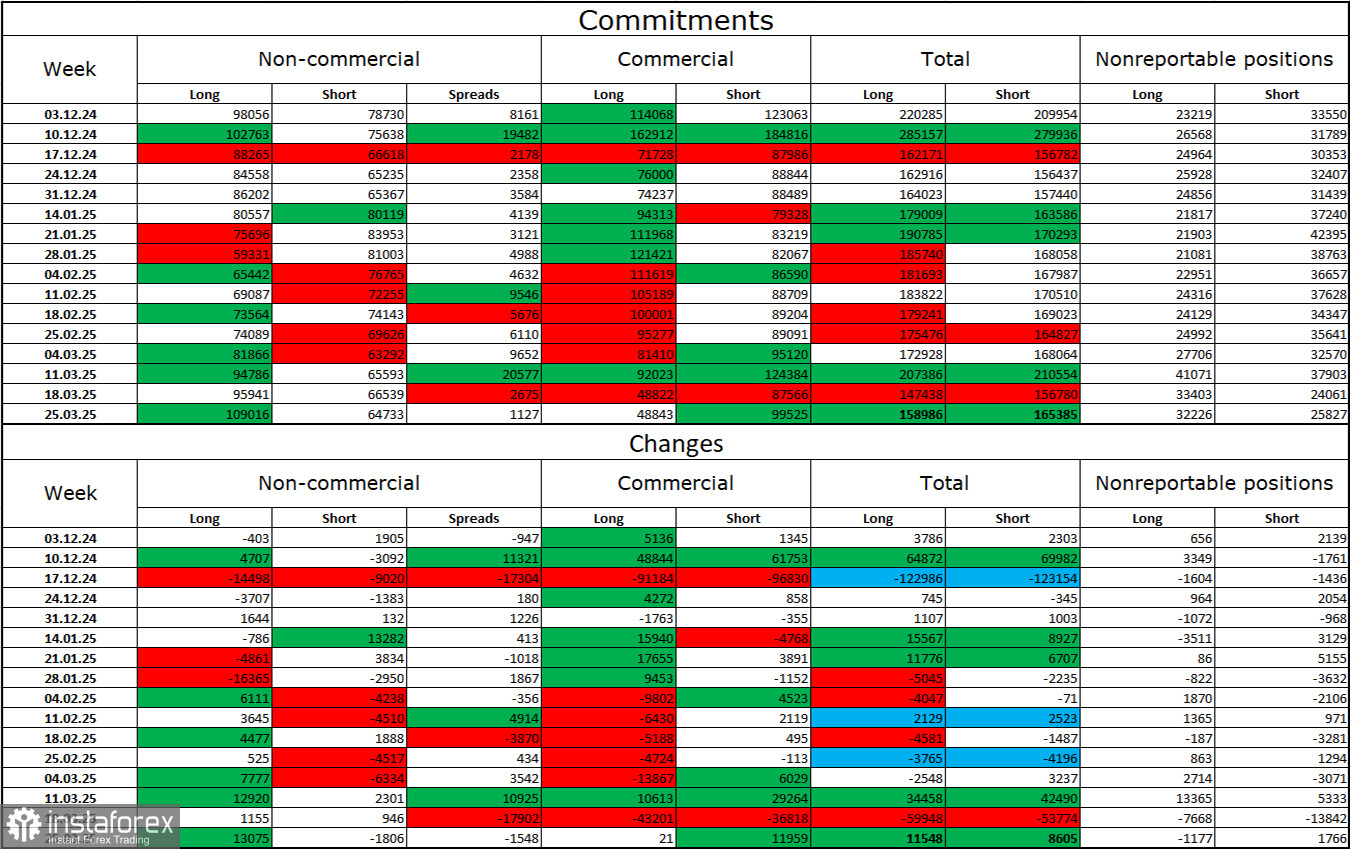
Sentiment among the "Non-commercial" trader category became more bullish in the latest reporting week. The number of long positions held by speculators increased by 13,075, while short positions declined by 1,806. Bears have lost their advantage in the market. The gap between long and short positions now stands at nearly 44,000 in favor of the bulls: 109,000 vs. 65,000.

In my view, the pound still has potential for a decline, but recent developments could cause the market to reverse in the long term. Over the past three months, the number of long positions has grown from 98,000 to 109,000, while short positions decreased from 78,000 to 65,000. More importantly, over the last 8 weeks, long positions rose from 59,000 to 109,000, while shorts fell from 81,000 to 65,000.

News Calendar for the U.S. and UK:

  • UK – S&P Manufacturing PMI (08:30 UTC)
  • U.S. – S&P Manufacturing PMI (13:45 UTC)
  • U.S. – ISM Manufacturing PMI (14:00 UTC)
  • U.S. – JOLTS Job Openings (14:00 UTC)

On Tuesday, the economic events calendar includes four key releases, each of which could significantly influence market sentiment throughout the day.

GBP/USD Forecast and Trader Tips:

Selling the pair is possible after a new rebound from the 1.3003 level on the hourly chart, with targets at 1.2931 and 1.2865, as the pair remains range-bound. Buying is possible after a rebound from the 1.2865 level, with targets at 1.2931 and 1.3003.

Fibonacci levels are built from 1.2809–1.2100 on the hourly chart and from 1.2299–1.3432 on the 4-hour chart.

Samir Klishi,
Analytical expert of InstaTrade
© 2007-2025

Recommended Stories

EUR/USD. June 12. A Setback for the Dollar

Good day, dear traders! On Wednesday, the EUR/USD pair continued its upward movement after rebounding from the support zone of 1.1374–1.1380. It successfully consolidated above the 76.4% Fibonacci retracement level

Samir Klishi 10:15 2025-06-12 UTC+2

GBP/USD. June 12. British Economy Falters

Good day, dear traders! On the hourly chart, on Wednesday, the GBP/USD pair reversed in favor of the British pound and consolidated above the 161.8% Fibonacci retracement level at 1.3520

Samir Klishi 10:15 2025-06-12 UTC+2

Technical Analysis of Daily Price Movement Crude Oil Commodity Instrument, Thursday June 12, 2025.

If we look at the daily chart of the Crude Oil commodity instrument, there appears to be a Divergence between the price movement of #CL and the Stochastic Oscillator indicator

Arief Makmur 08:10 2025-06-12 UTC+2

Technical Analysis of Intraday Price Movement of Nasdaq 100 Index, Thursday June 12, 2025.

On the 4-hour chart of the Nasdaq 100 index, there is a divergence between its price movement and the Stochastic Oscillator indicator, especially with the current confirmation of the price

Arief Makmur 08:10 2025-06-12 UTC+2

Trading Signals for EUR/USD for June 12-19, 2025: sell below 1.1500 (21 SMA - 8/8 Murray)

If the euro price falls below 1.1500 in the coming hours, this could be seen as an opportunity to sell. Technically, it appears overbought on the H4 chart and could

Dimitrios Zappas 05:33 2025-06-12 UTC+2

Trading Signals for GOLD (XAU/USD) for June 12-19, 2025: sell below $3,386 (21 SMA - 7/8 Murray)

The XAU/USD trend remains bullish as long as the price consolidates above 3,331. Therefore, it would be prudent to buy gold as long as the price consolidates above 3,359, where

Dimitrios Zappas 05:32 2025-06-12 UTC+2

EUR/USD Forecast for June 12, 2025

The U.S. inflation data released on Wednesday stirred the markets: the dollar index dropped by 0.47%, WTI oil surged by 5.54%, gold rose by 1.27%, and 5-year U.S. Treasury yields

Laurie Bailey 04:40 2025-06-12 UTC+2

GBP/USD Forecast for June 12, 2025

On Wednesday, the British pound successfully avoided a decline below technical support levels, reversing upward from them. The price rebounded from the MACD indicator line on the daily chart, while

Laurie Bailey 04:40 2025-06-12 UTC+2

USD/JPY Forecast for June 12, 2025

The price correction since May 27 was complex and prolonged, posing a risk of a breakout above 146.11. However, this risk is no longer a concern with the reversal from

Laurie Bailey 04:40 2025-06-12 UTC+2

Bitcoin: Dollar Strength Could Trigger a Downturn in the Crypto Market

Today, the market's main focus will be the release of the U.S. inflation report, which is expected to show not only a halt in the recent decline but the highest

Pati Gani 11:47 2025-06-11 UTC+2
Can't speak right now?
Ask your question in the chat.
 

Dear visitor,

Your IP address shows that you are currently located in the USA. If you are a resident of the United States, you are prohibited from using the services of InstaFintech Group including online trading, online transfers, deposit/withdrawal of funds, etc.

If you think you are seeing this message by mistake and your location is not the US, kindly proceed to the website. Otherwise, you must leave the website in order to comply with government restrictions.

Why does your IP address show your location as the USA?

  • - you are using a VPN provided by a hosting company based in the United States;
  • - your IP does not have proper WHOIS records;
  • - an error occurred in the WHOIS geolocation database.

Please confirm whether you are a US resident or not by clicking the relevant button below. If you choose the wrong option, being a US resident, you will not be able to open an account with InstaTrade anyway.

We are sorry for any inconvenience caused by this message.